Visual Data Transformation Needed? Configure Mapping Data Flow
A report needs only sales above 5, but the incoming CSV contains every sale. The data must be read as columns, filtered by amount, and written for reporting. Mapping Data Flow lets you connect these transformations visually; Azure runs them on managed Apache Spark compute.
Reuse adf-ctappweu, stctadfweu, the ls_ctstorage connection, and pipeline/input/sales.csv from Create Azure Data Factory. The file contains Notebook at 12.50 and Pen at 2.00. Keep the factory’s Storage Blob Data Contributor assignment.
Read the CSV as Columns
In Data Factory Studio, open Author → + → Dataset → Azure Blob Storage → DelimitedText:
Name: ds_sales_csv
Linked service: ls_ctstorage
Container: pipeline
Directory: input
File: sales.csv
First row as header: Checked
Import schema: From connection/store
Keep the comma delimiter. The dataset describes the file’s location and columns.
Select Author → + → Data flow → Mapping Data Flow, name it df_filter_sales, and add a source named sales using ds_sales_csv. Under Projection, confirm order_id, product, and amount appear.
Keep Sales Above 5
Select + after the source → Filter, name it aboveFive, and enter this expression under Filter on:
toDecimal(amount, 10, 2) > 5It converts the amount to a number with two decimal places before comparing it. Enable Data flow debug with the default small configuration and wait for it to become ready. Debug starts billable Spark compute, including while you edit.
Select the filter’s Data preview → Refresh.
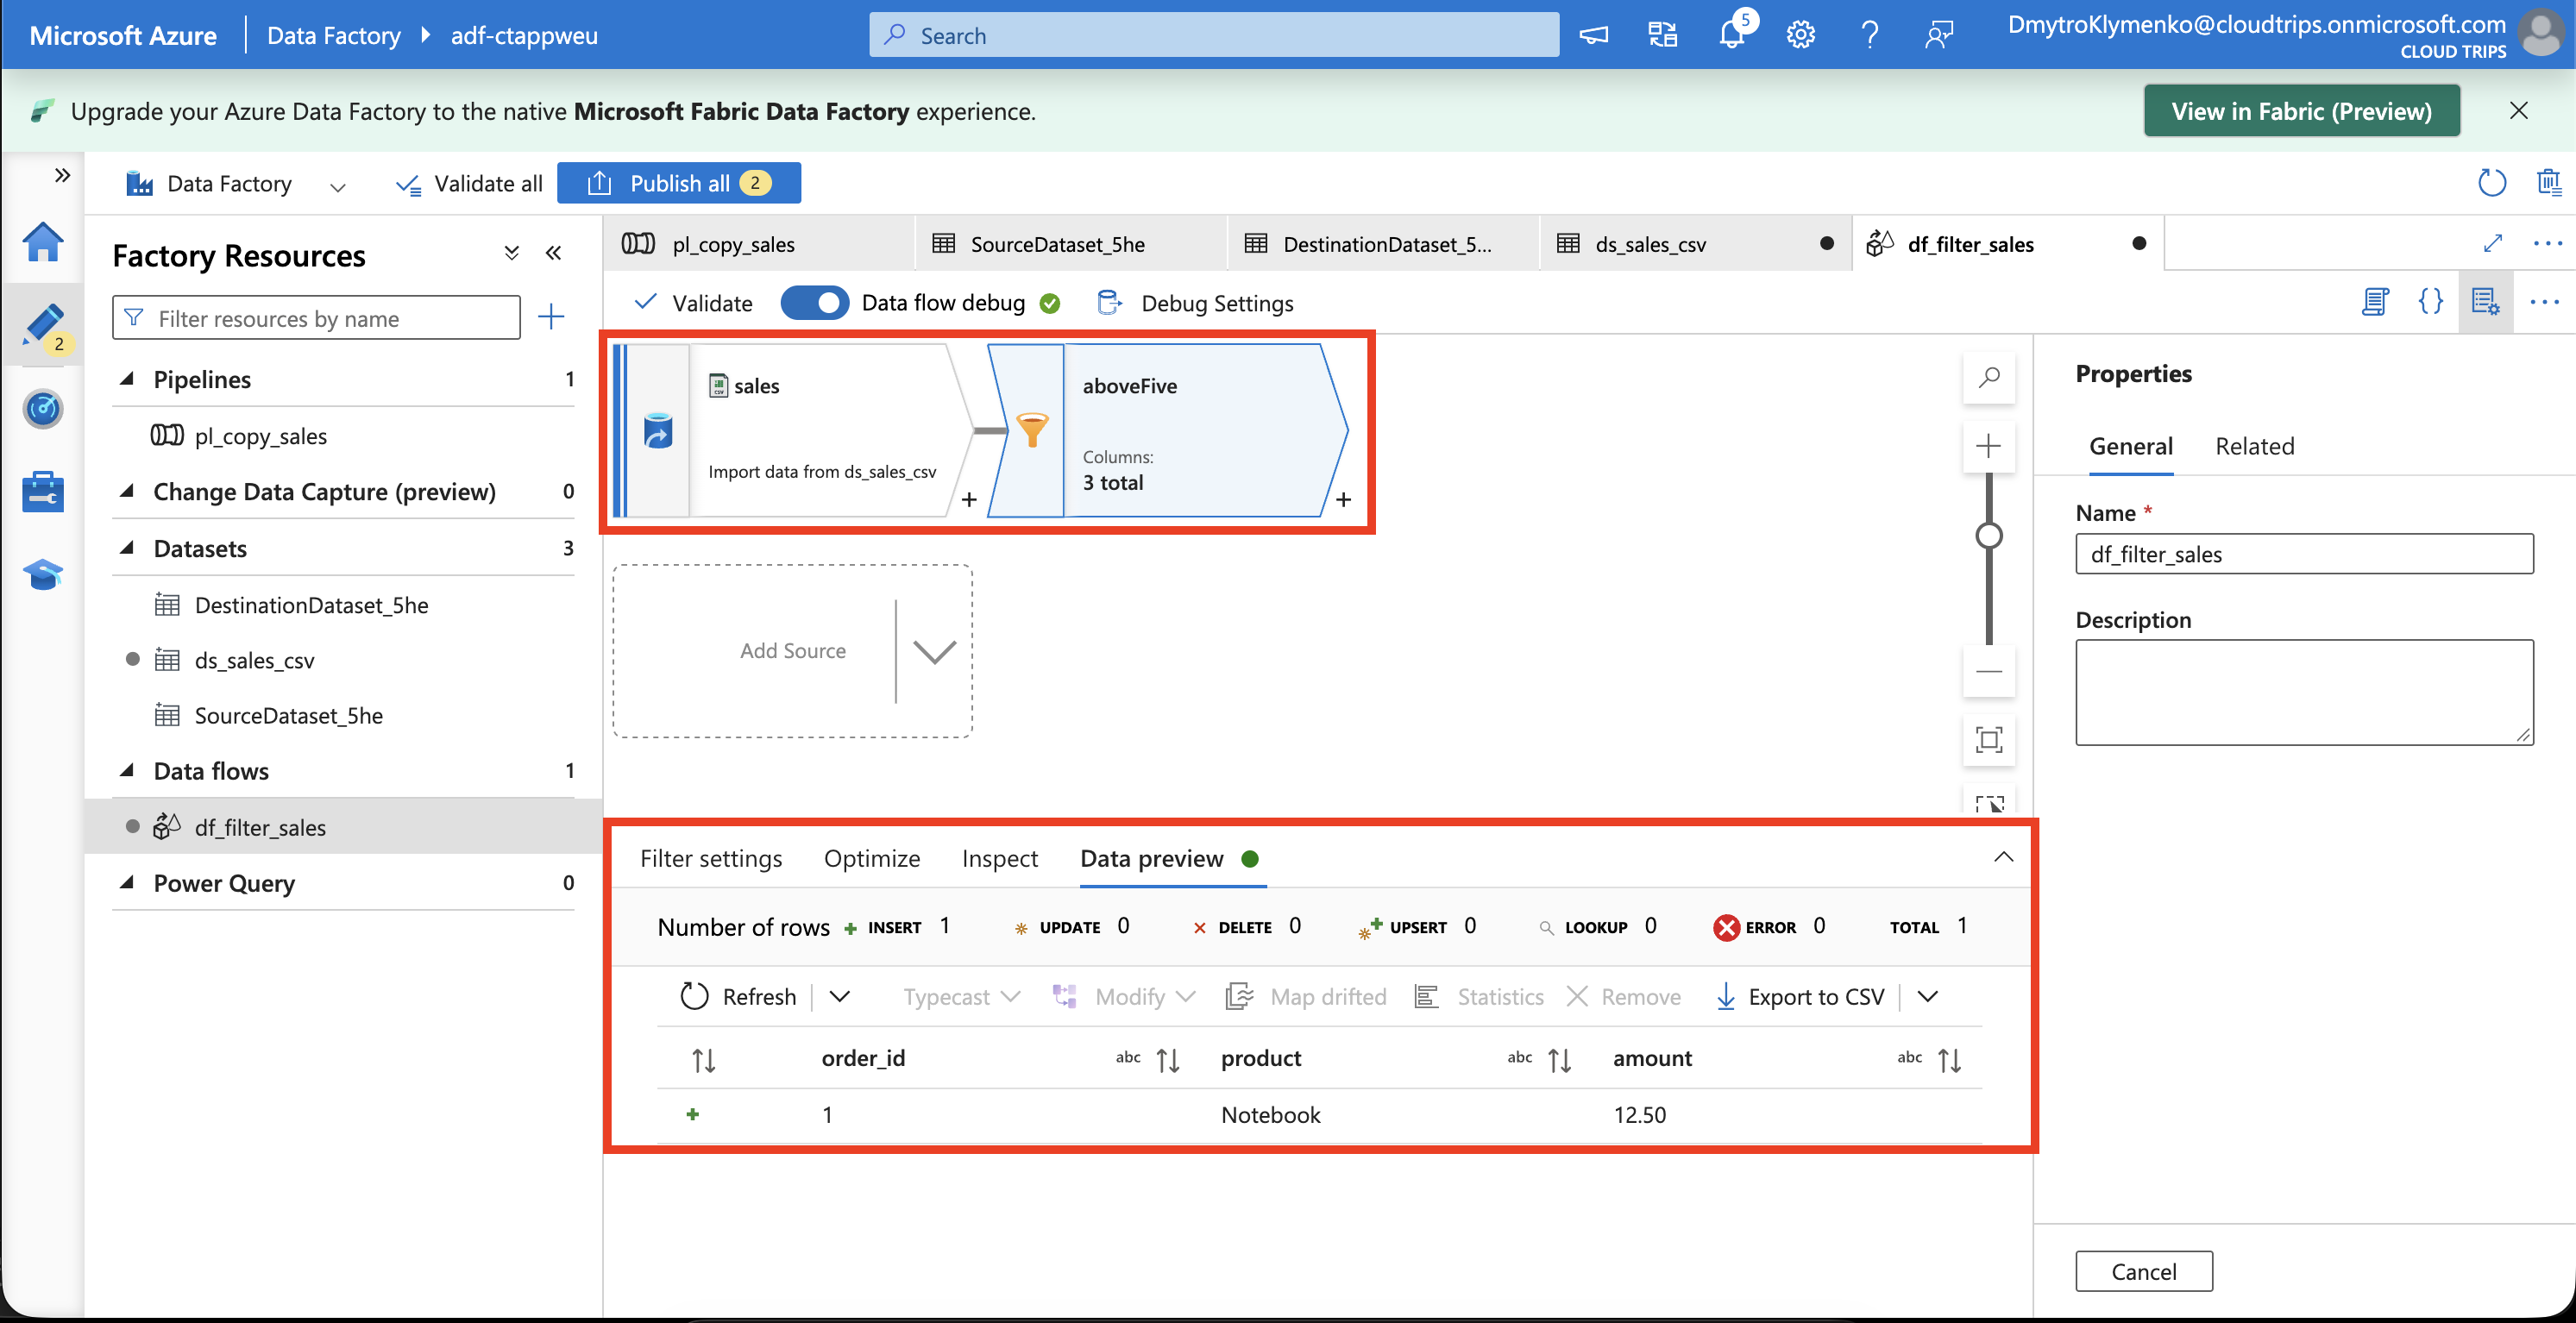
Expect one row: order_id 1, Notebook, amount 12.50. The preview shows which row passes the filter.
Write the Result
Select + after the filter → Sink, name it filteredSales, and create a new Azure Blob Storage → DelimitedText dataset:
Name: ds_sales_processed
Linked service: ls_ctstorage
Container: pipeline
Directory: processed
File: leave empty
First row as header: Checked
Import schema: None
Type processed directly into the directory field; the run creates this folder. In the sink’s Settings, choose File name option → Output to single file, enter sales-filtered.csv, and accept single partitioning if prompted. Keep automatic column mapping. One file is convenient for this small example; larger workloads benefit from parallel output files.
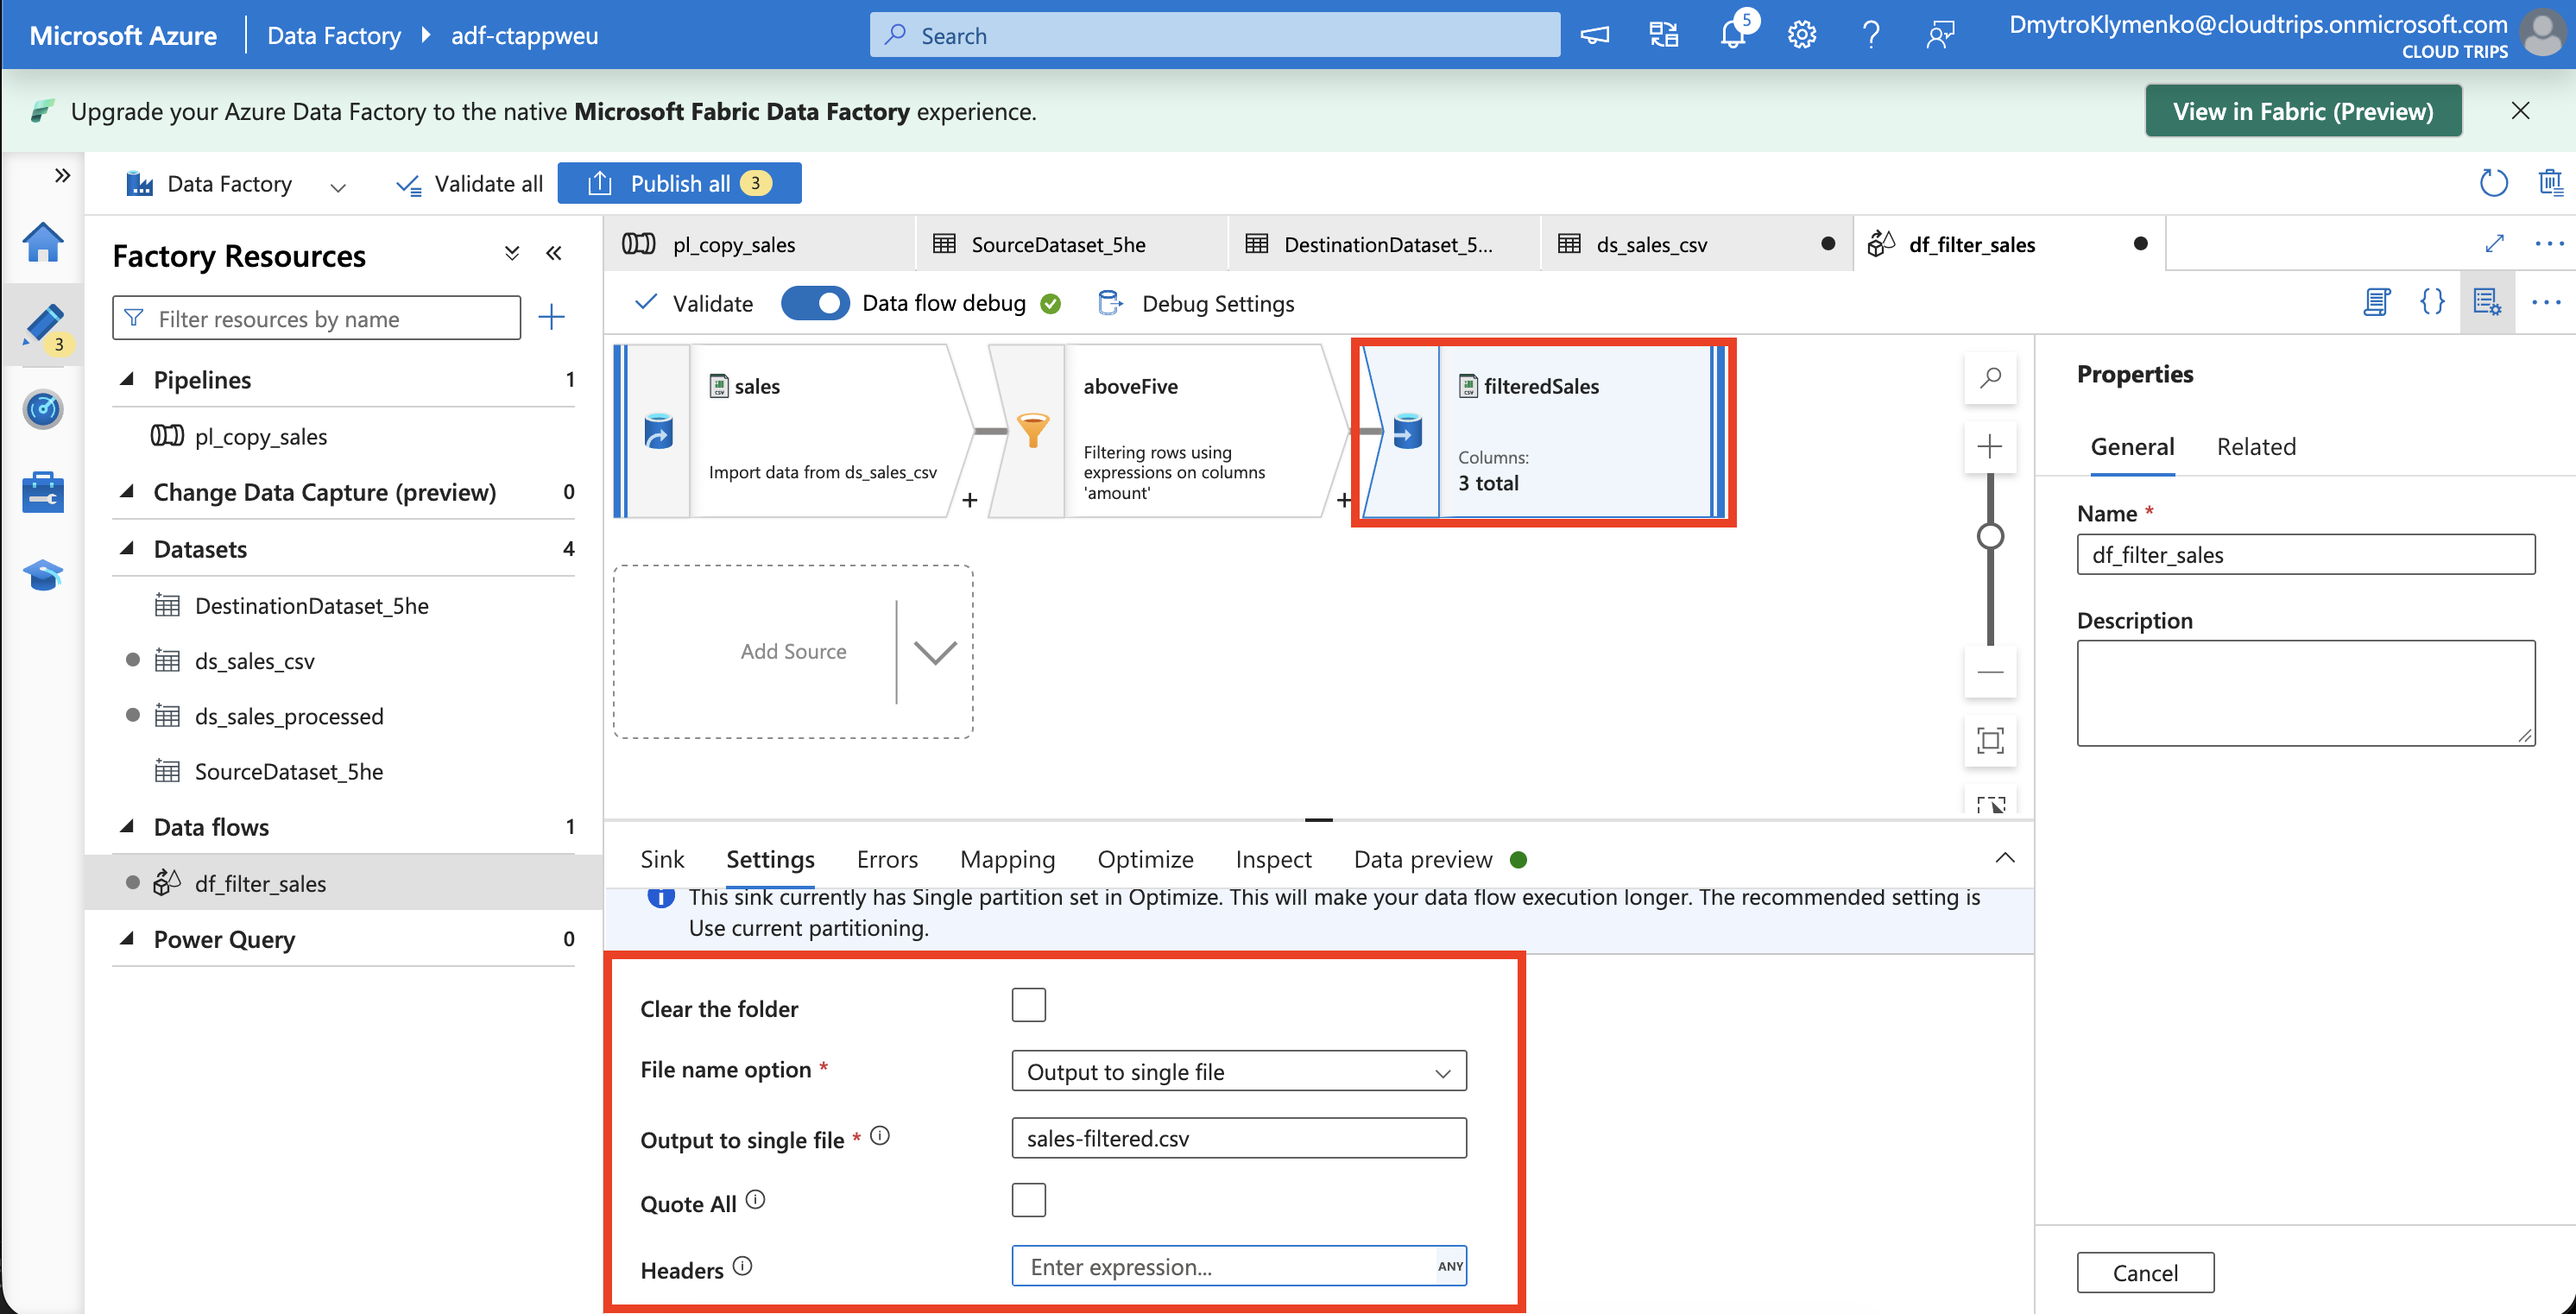
Check the flow order and output filename. Preview evaluates the transformations; running a pipeline writes the output.
Run and Verify
Turn Data flow debug off. Create a pipeline named pl_transform_sales, add a Data Flow activity, and select df_filter_sales under Settings, using AutoResolveIntegrationRuntime. Select Validate → Publish all, then Add trigger → Trigger now.
Open Monitor, wait for Succeeded, and open the Data Flow activity details.
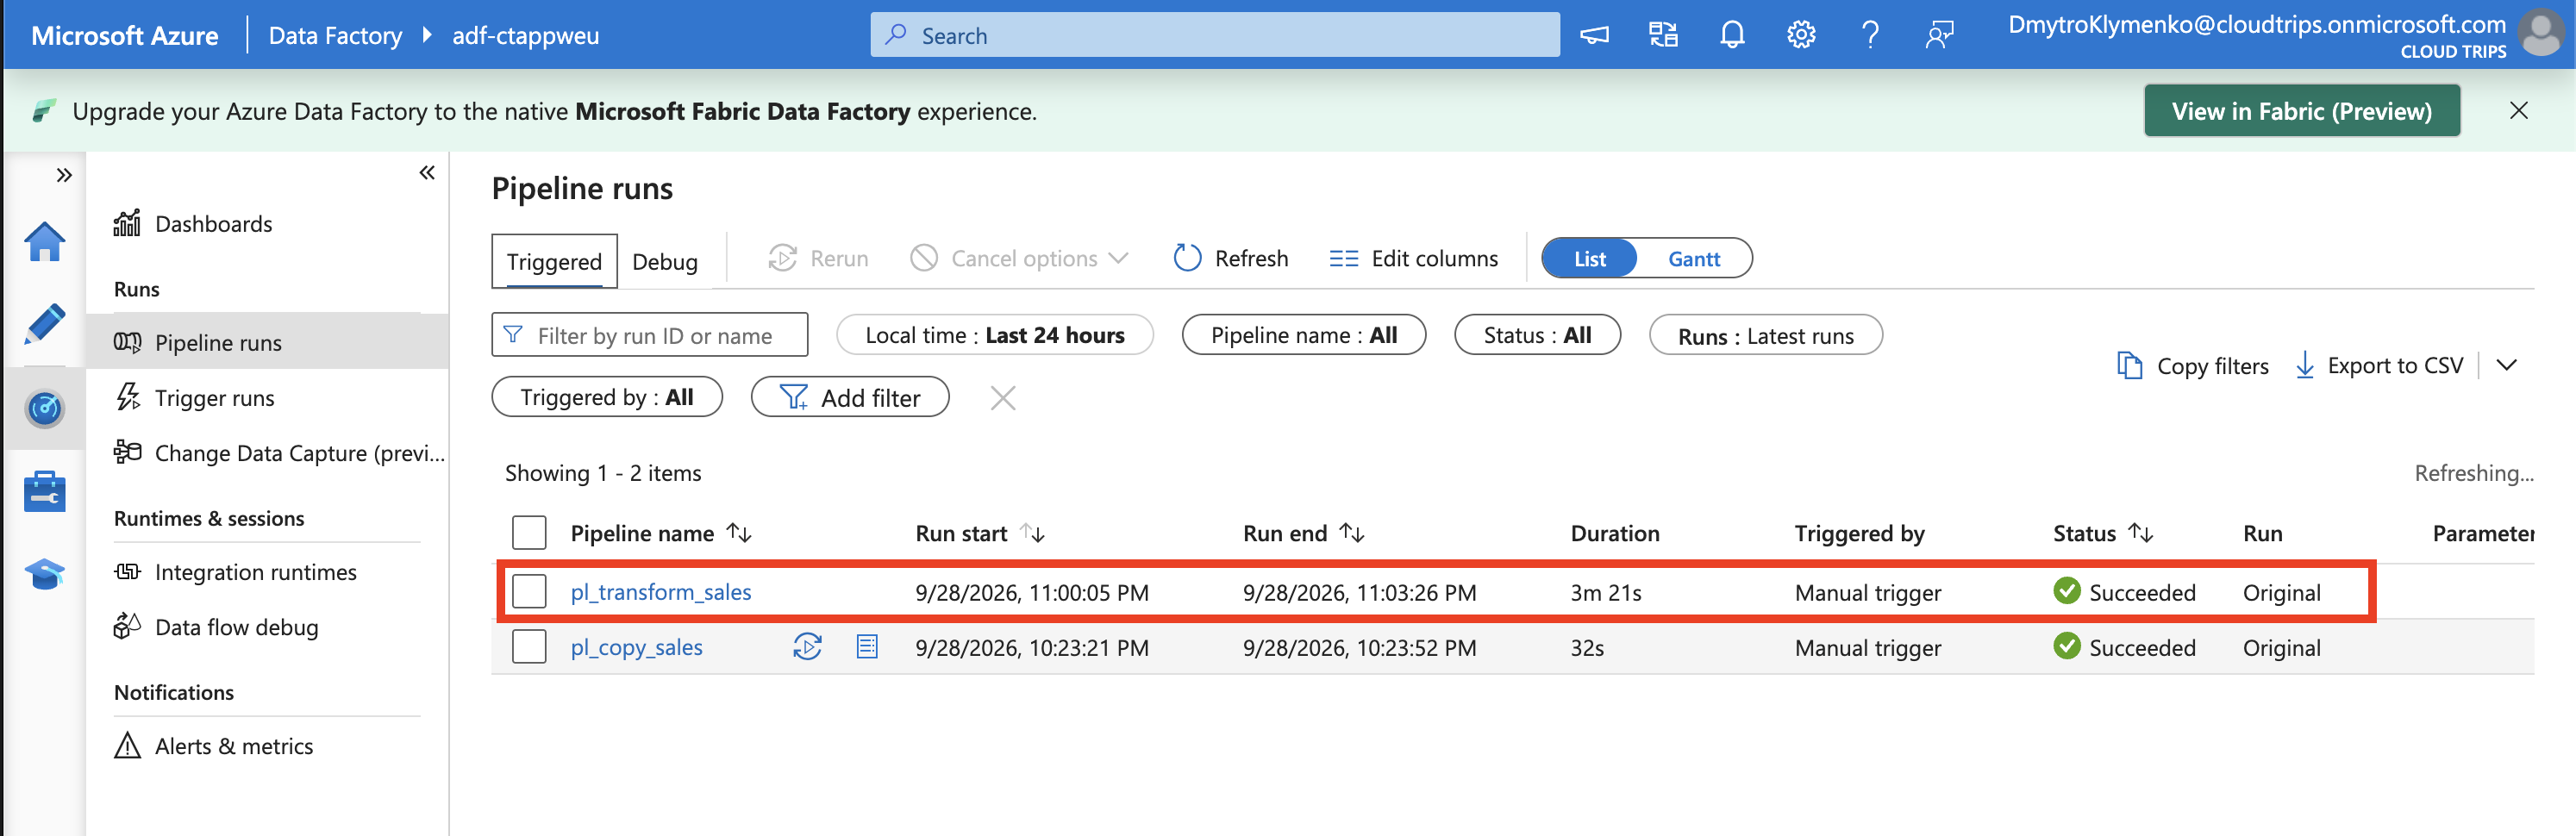
Check Succeeded. If row metrics are available, expect 2 rows read and 1 row written. Spark startup can take several minutes even for this tiny file.
Next, open stctadfweu → Containers → pipeline → processed and refresh.
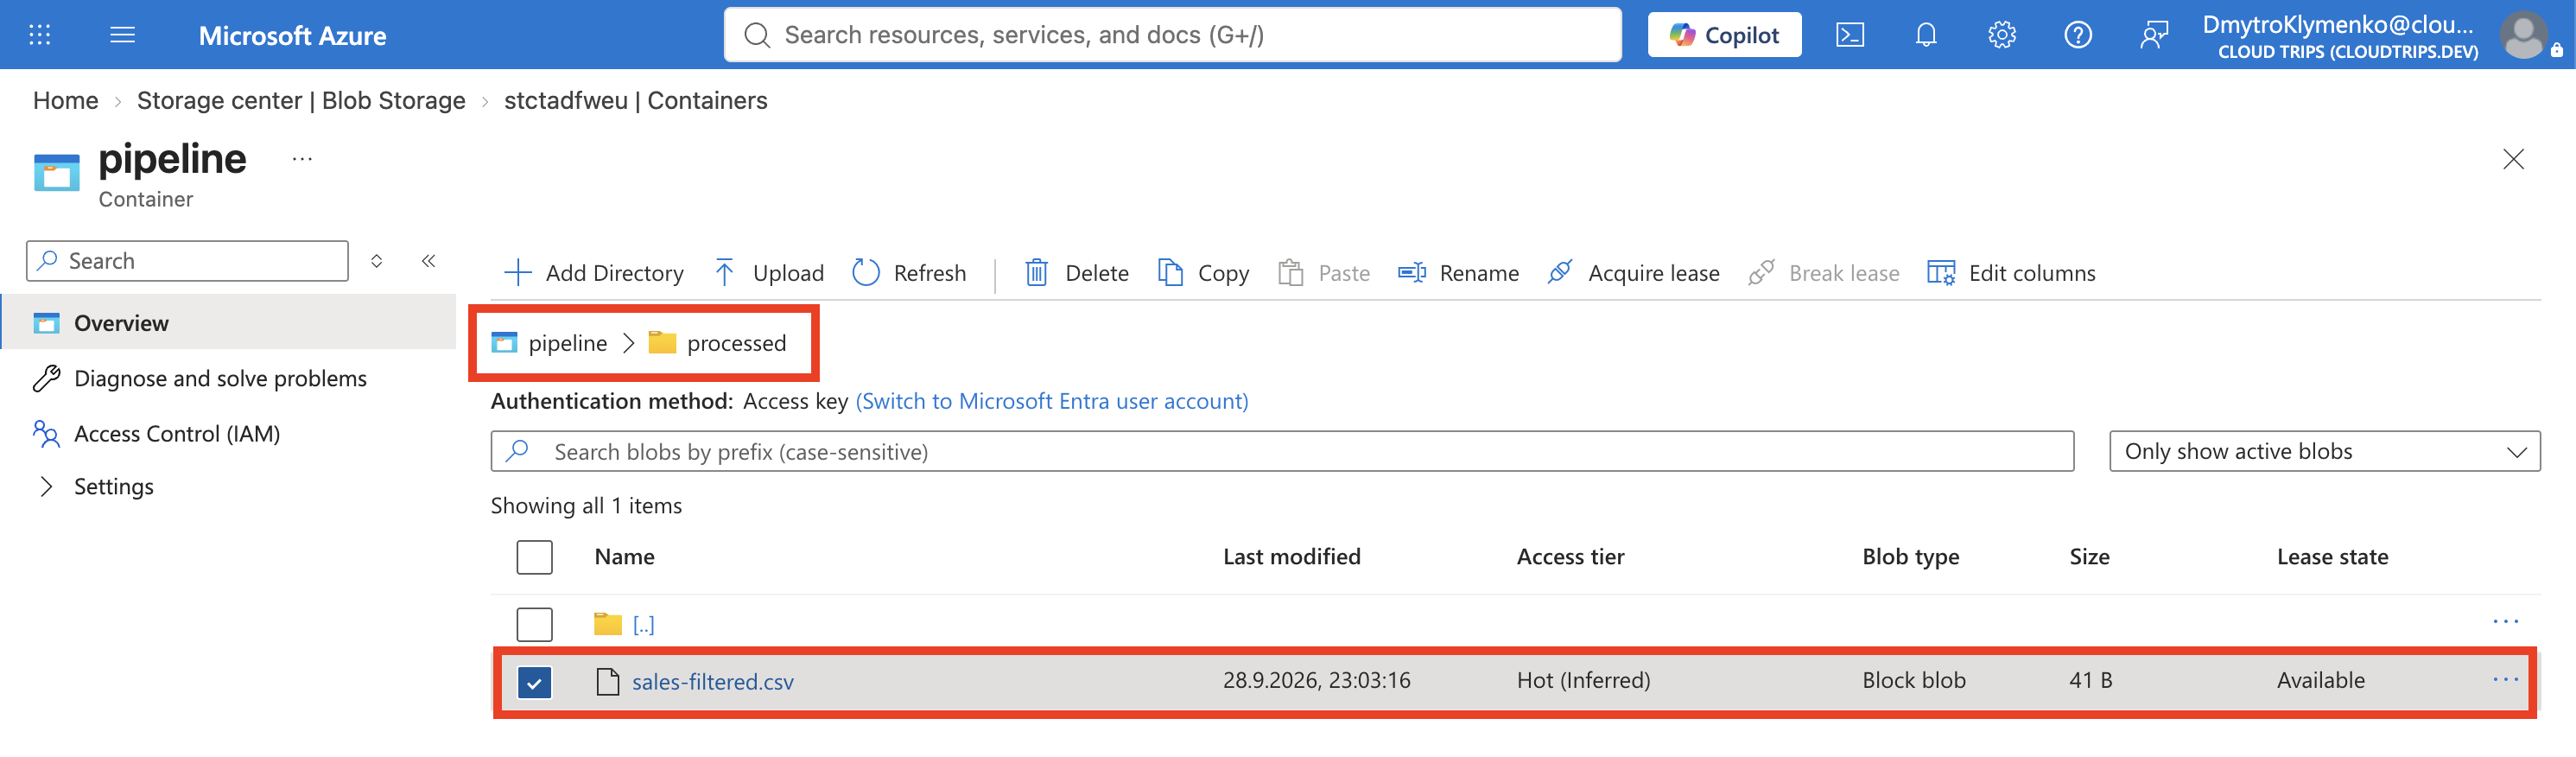
Check that sales-filtered.csv appears in the output folder. Open or download it and confirm the header and one Notebook record, with amount numerically equal to 12.50. This verifies the saved transformation result.
Finish
Keep debug switched off after testing. Pipeline runs incur Spark compute charges. Retain the resources for the next trip, or delete rg-cloudtrips-adf-test-weu when finished.