Leadership Needs a Cloud Cost View? Create a FinOps Dashboard
Leadership should not have to open every subscription to understand CloudTrips spending. It needs one view that answers three questions:
- How much has CloudTrips spent this month?
- Which environment is responsible for the cost?
- Which Azure services are the largest cost drivers?
FinOps, short for Cloud Financial Operations, is the practice of making cloud-cost decisions a shared responsibility between engineering, finance, and business teams. A dashboard supports that practice by making cost data visible, but it does not replace budgets, alerts, ownership, or regular cost reviews.
This trip creates a lightweight FinOps dashboard with native Cost Analysis views. It does not deploy the more advanced Microsoft FinOps toolkit or Power BI reports.
Use:
Cost scope: CloudTrips Microsoft Customer Agreement billing profile
Current subscription filter: CloudTrips DEV
Add later: CloudTrips TEST, when it appears in Cost Analysis
Dashboard name: CloudTrips FinOps
Dashboard resource subscription: CloudTrips DEV
Resource group location: West Europe
The billing profile is the cost-data scope. CloudTrips DEV and West Europe only define where Azure stores the shared dashboard resource; they do not limit the costs displayed in its tiles. When the dashboard is published, Azure can create the default resource group named dashboards automatically.
Check Access and Cost Data
Open Cost Management + Billing, select the Microsoft Customer Agreement billing account, and then select its billing profile. Open Cost analysis.
Use the billing profile instead of the Online management group. Cost Management does not support management-group cost scopes for Microsoft Customer Agreement subscriptions.
At this point, CloudTrips DEV is available in the subscription filter, but the newly created CloudTrips TEST subscription has not appeared yet. Cost Analysis filters are built from available cost records, and a new subscription can take up to 48 hours to become available. A subscription with no reported usage might also be absent from the filter.
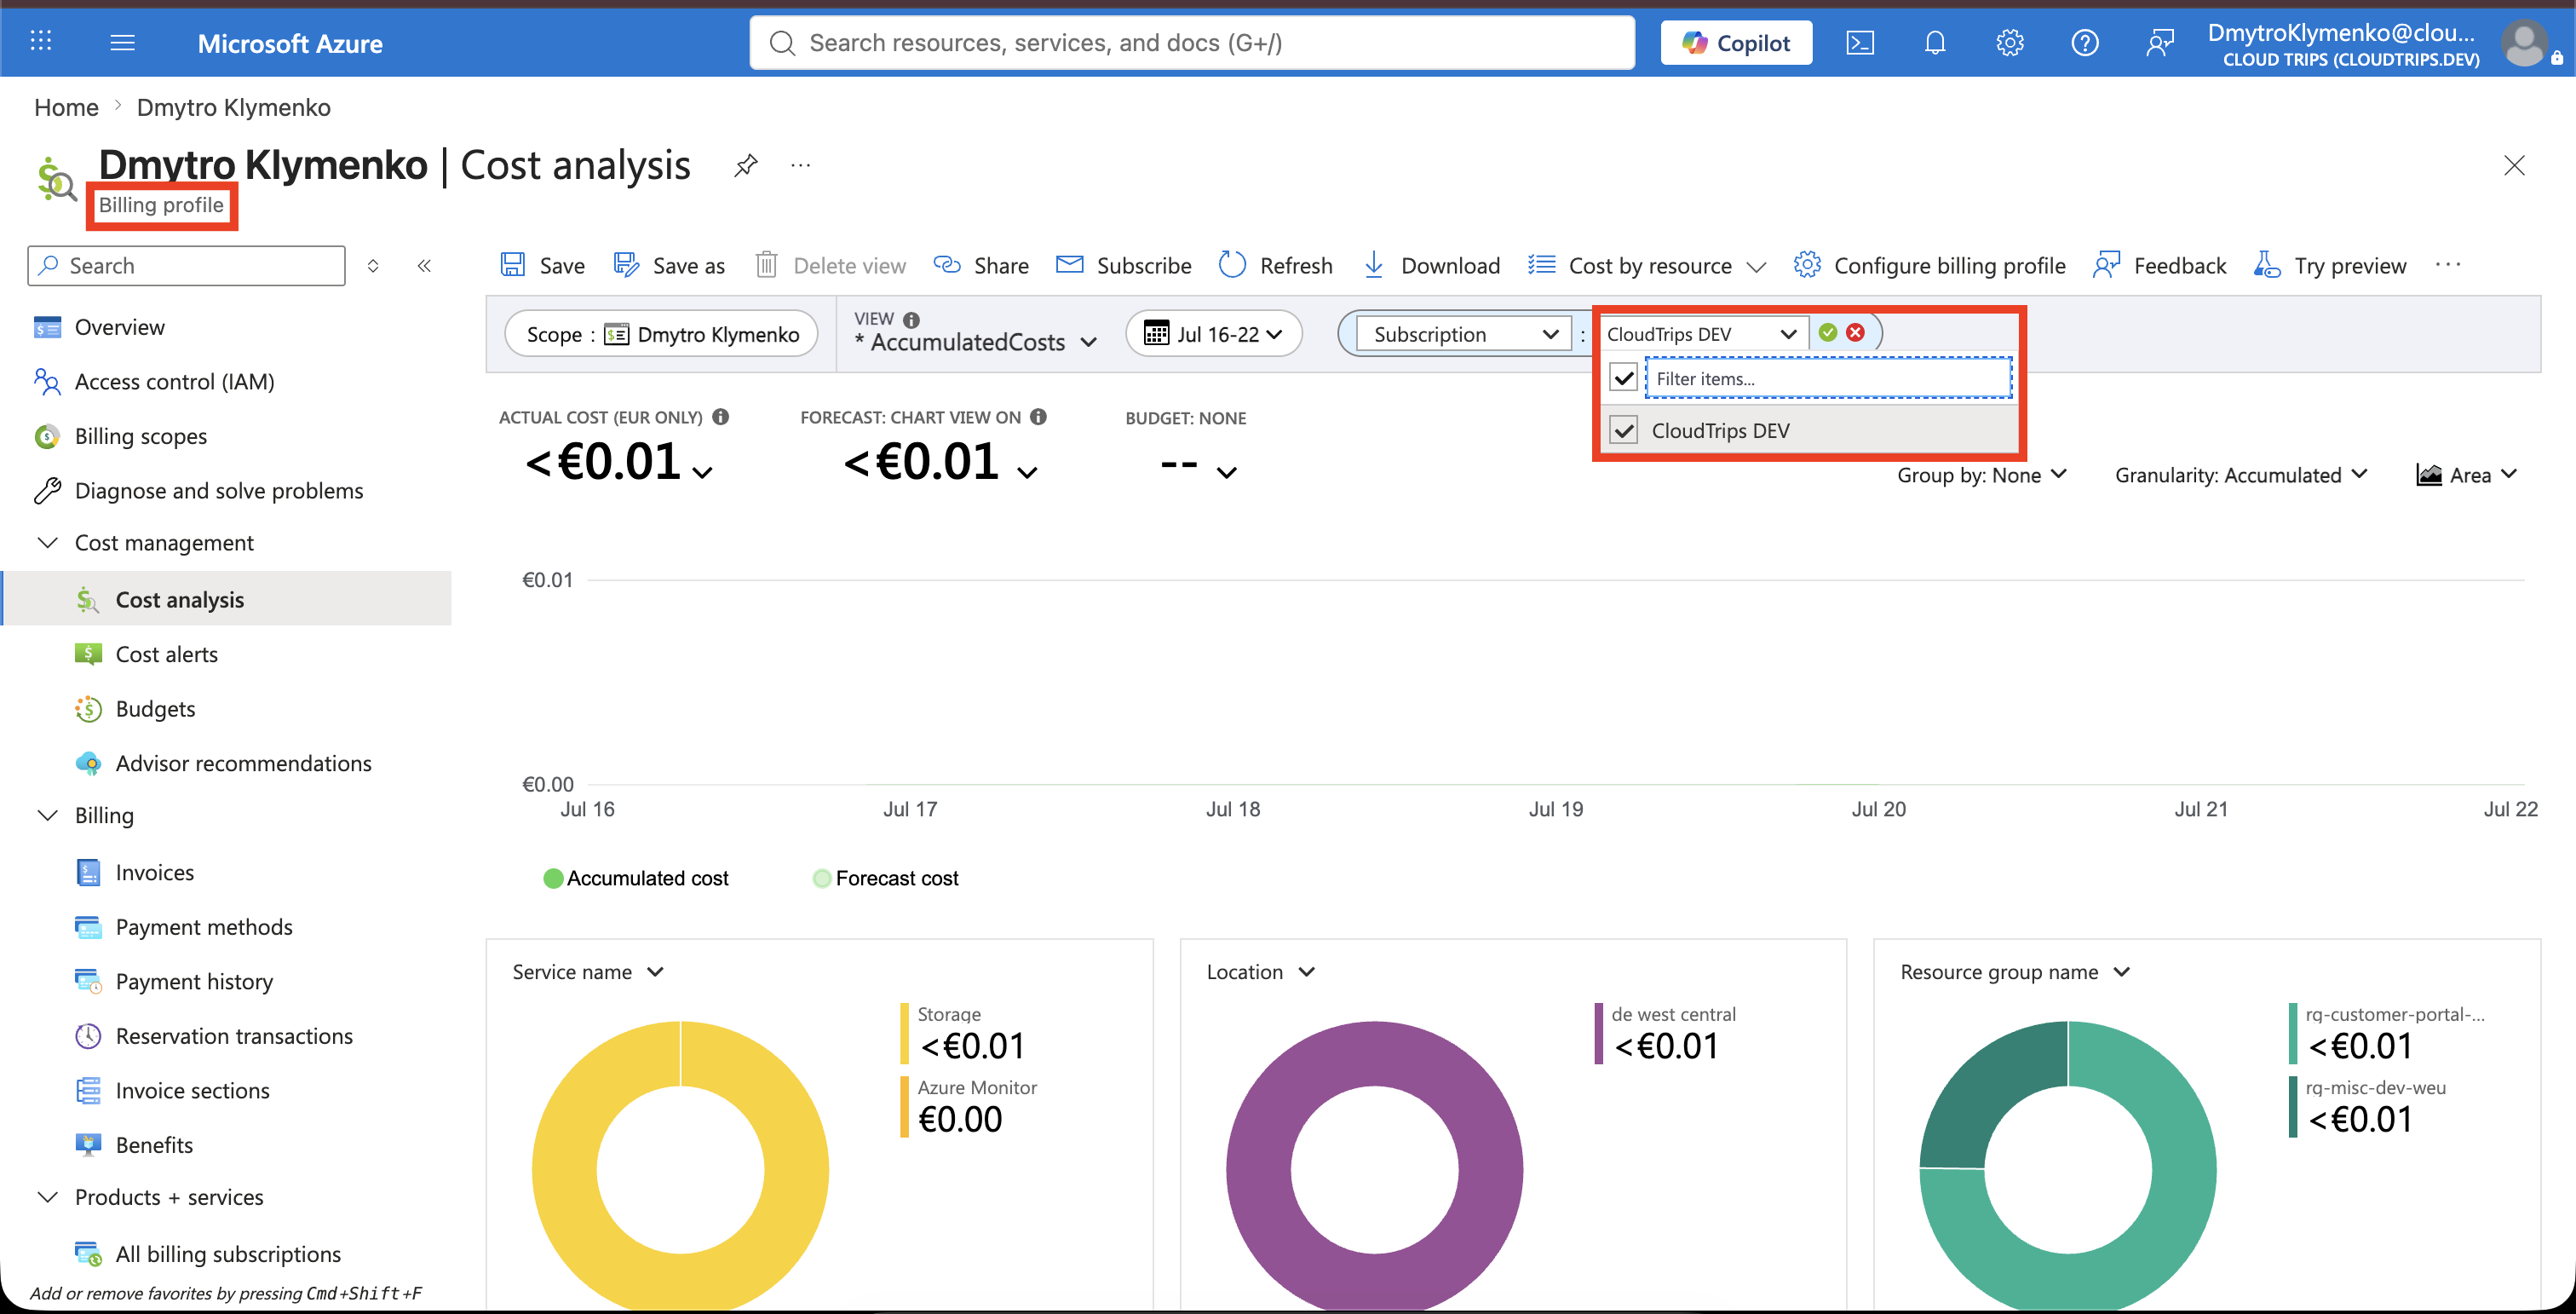
For now, use this filter in every view:
Filter: Subscription name
Value: CloudTrips DEV
After CloudTrips TEST produces cost data and appears in the list, edit each view and add it to the same filter. You need access to the billing profile’s cost data. You also need permission to create a shared dashboard resource in CloudTrips DEV.
Add the Current-Month Cost Tile
In Cost analysis, select the Accumulated costs view and set the date to This month. Apply the CloudTrips DEV subscription filter. Add CloudTrips TEST later when it becomes available.
This view shows accumulated actual cost and, when Azure has enough data, a forecast for the rest of the month. It gives leadership the fastest answer to whether current spending is on track.
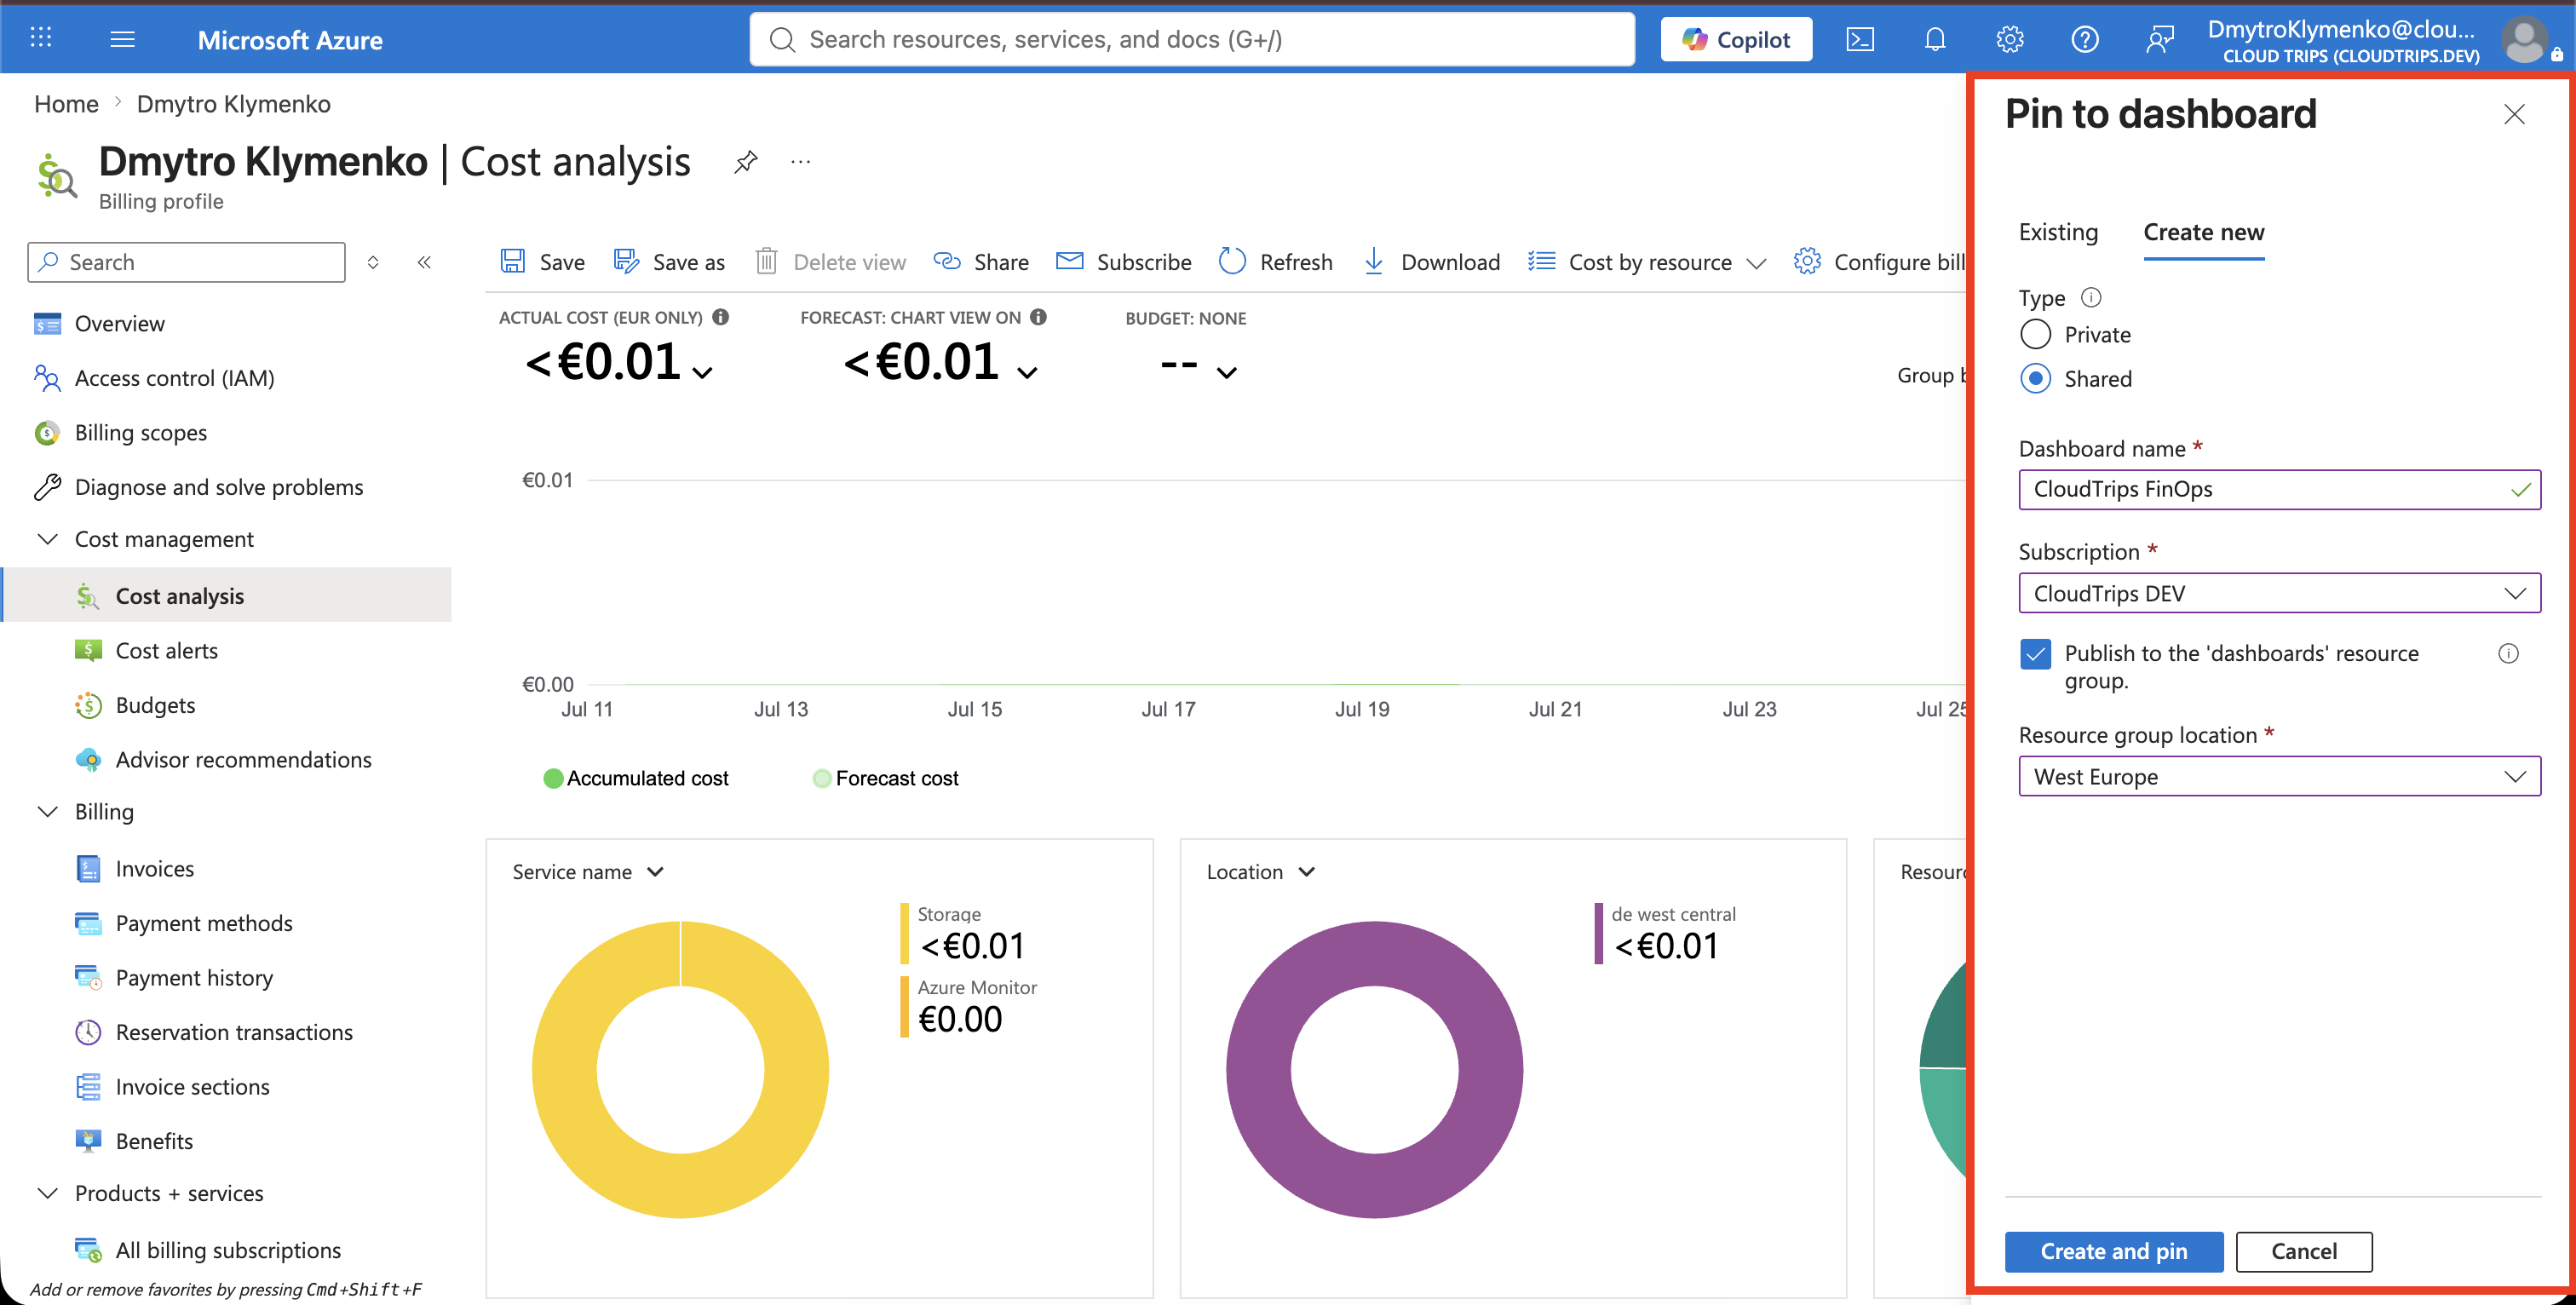
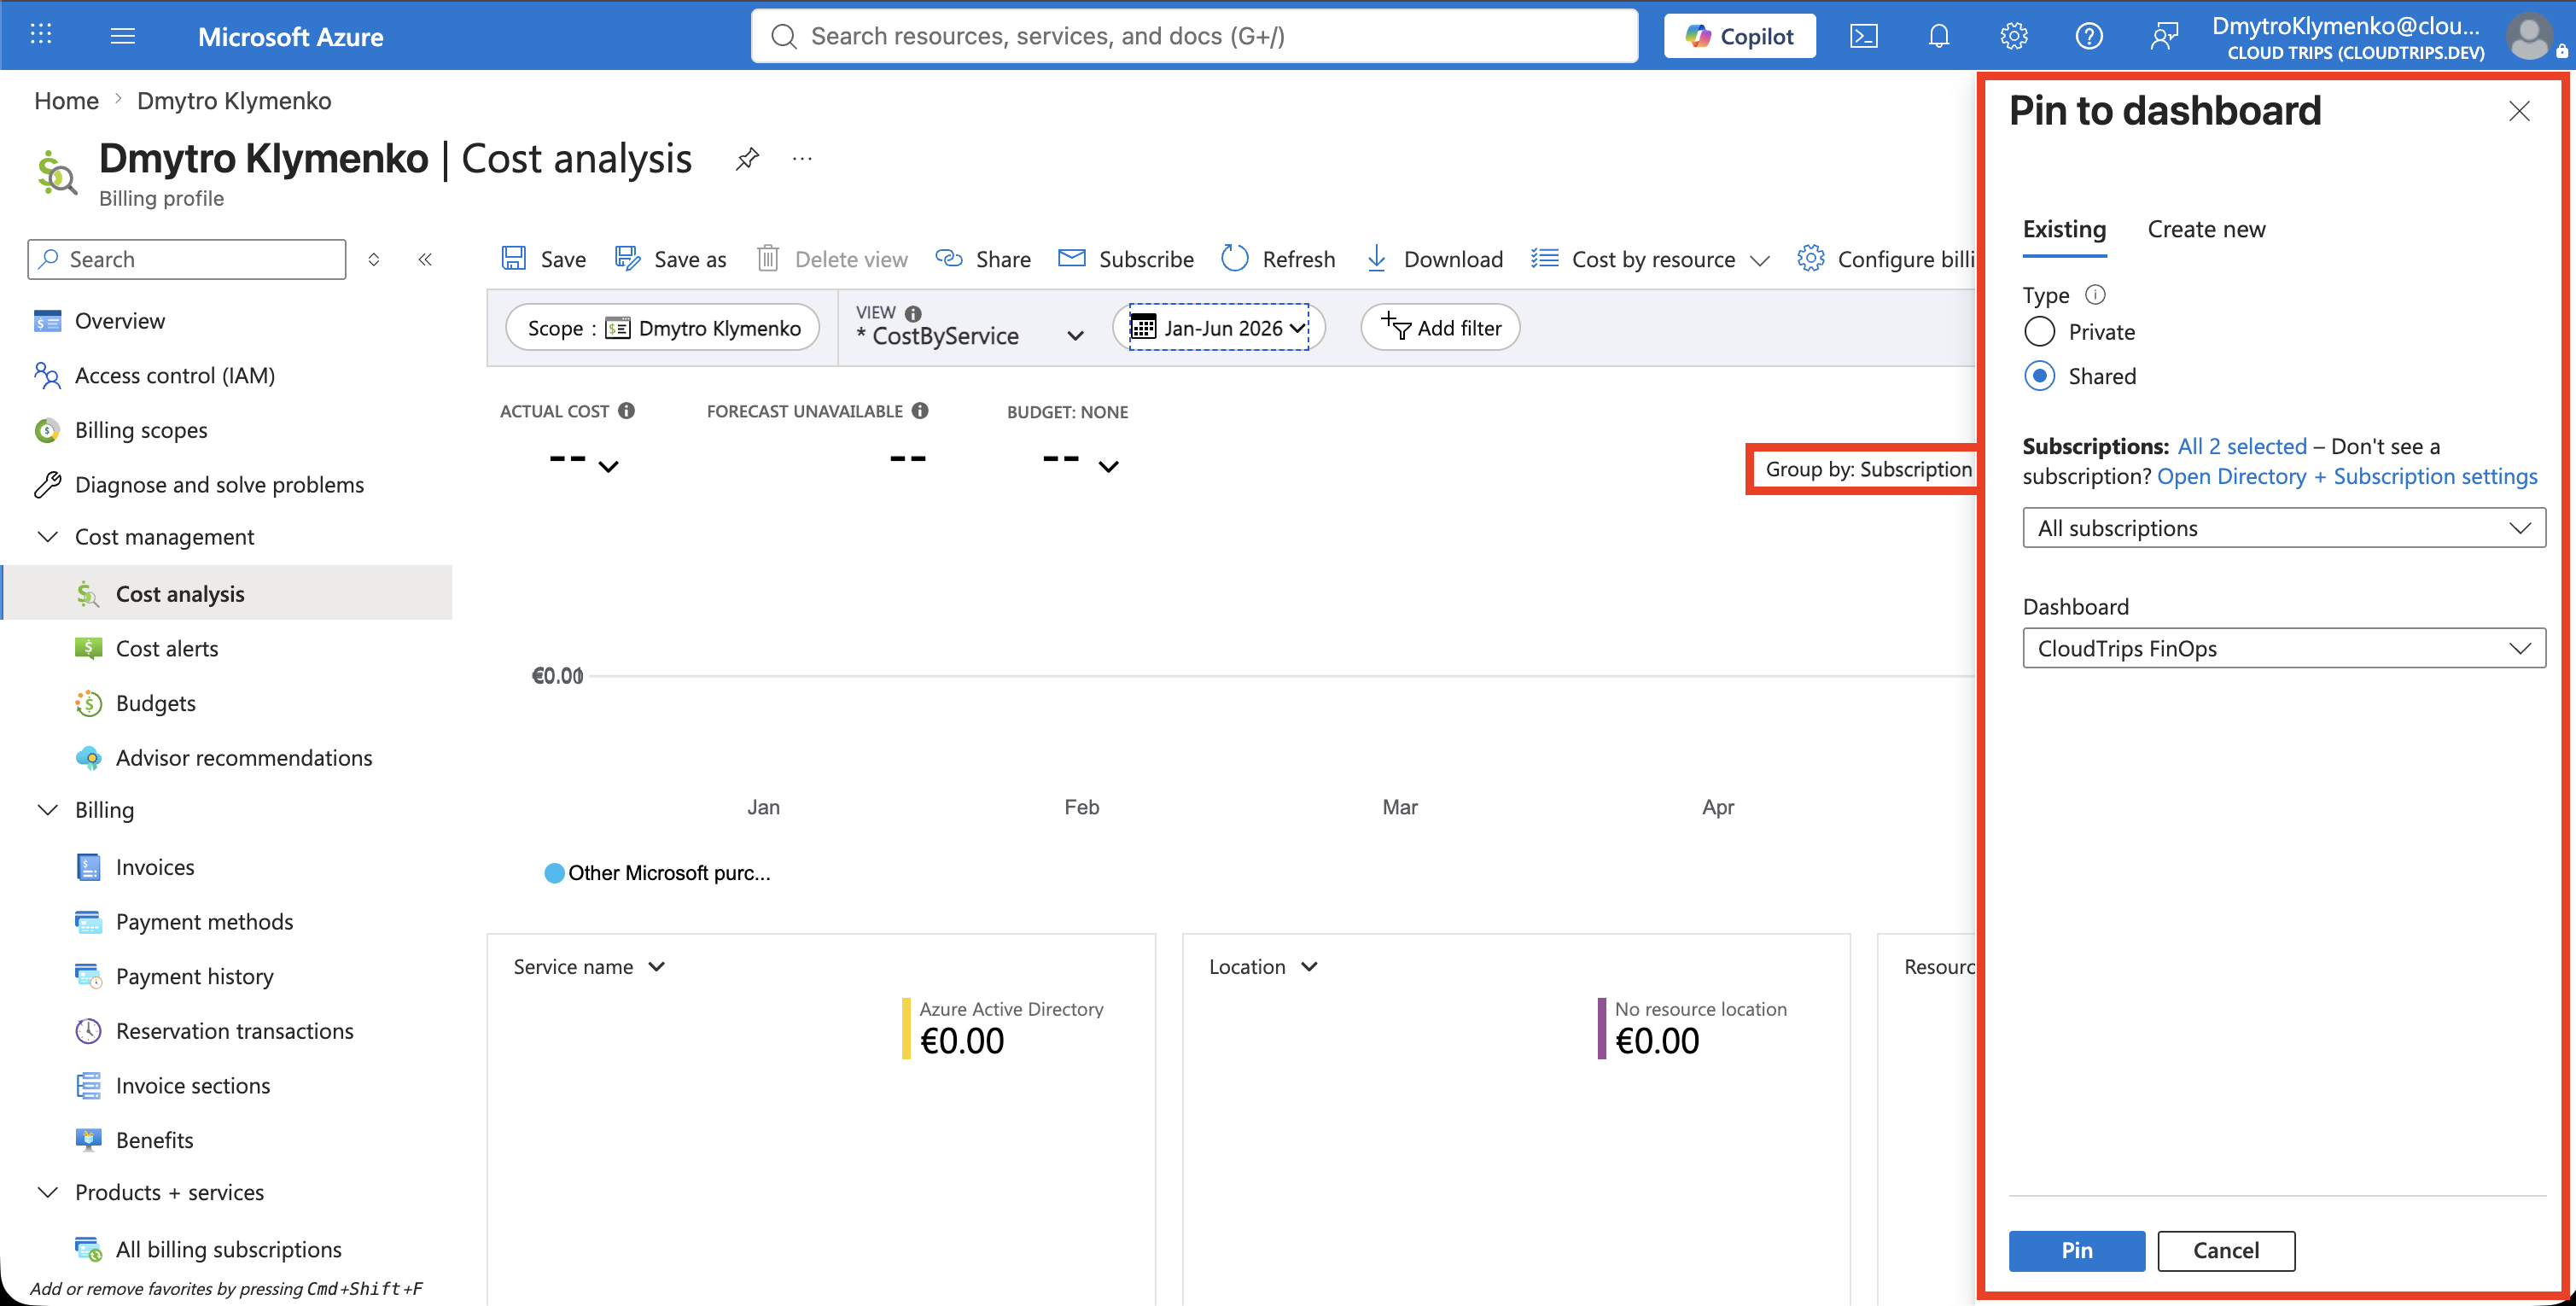
Select the Pin icon beside the billing-scope name. In Pin to dashboard, select Create new, choose Shared, and enter:
Dashboard name: CloudTrips FinOps
Subscription: CloudTrips DEV
Resource group location: West Europe
Select Pin. If Azure asks you to publish the shared dashboard, select Publish. Azure creates or uses the default dashboards resource group in the selected location.
Add the Environment Breakdown
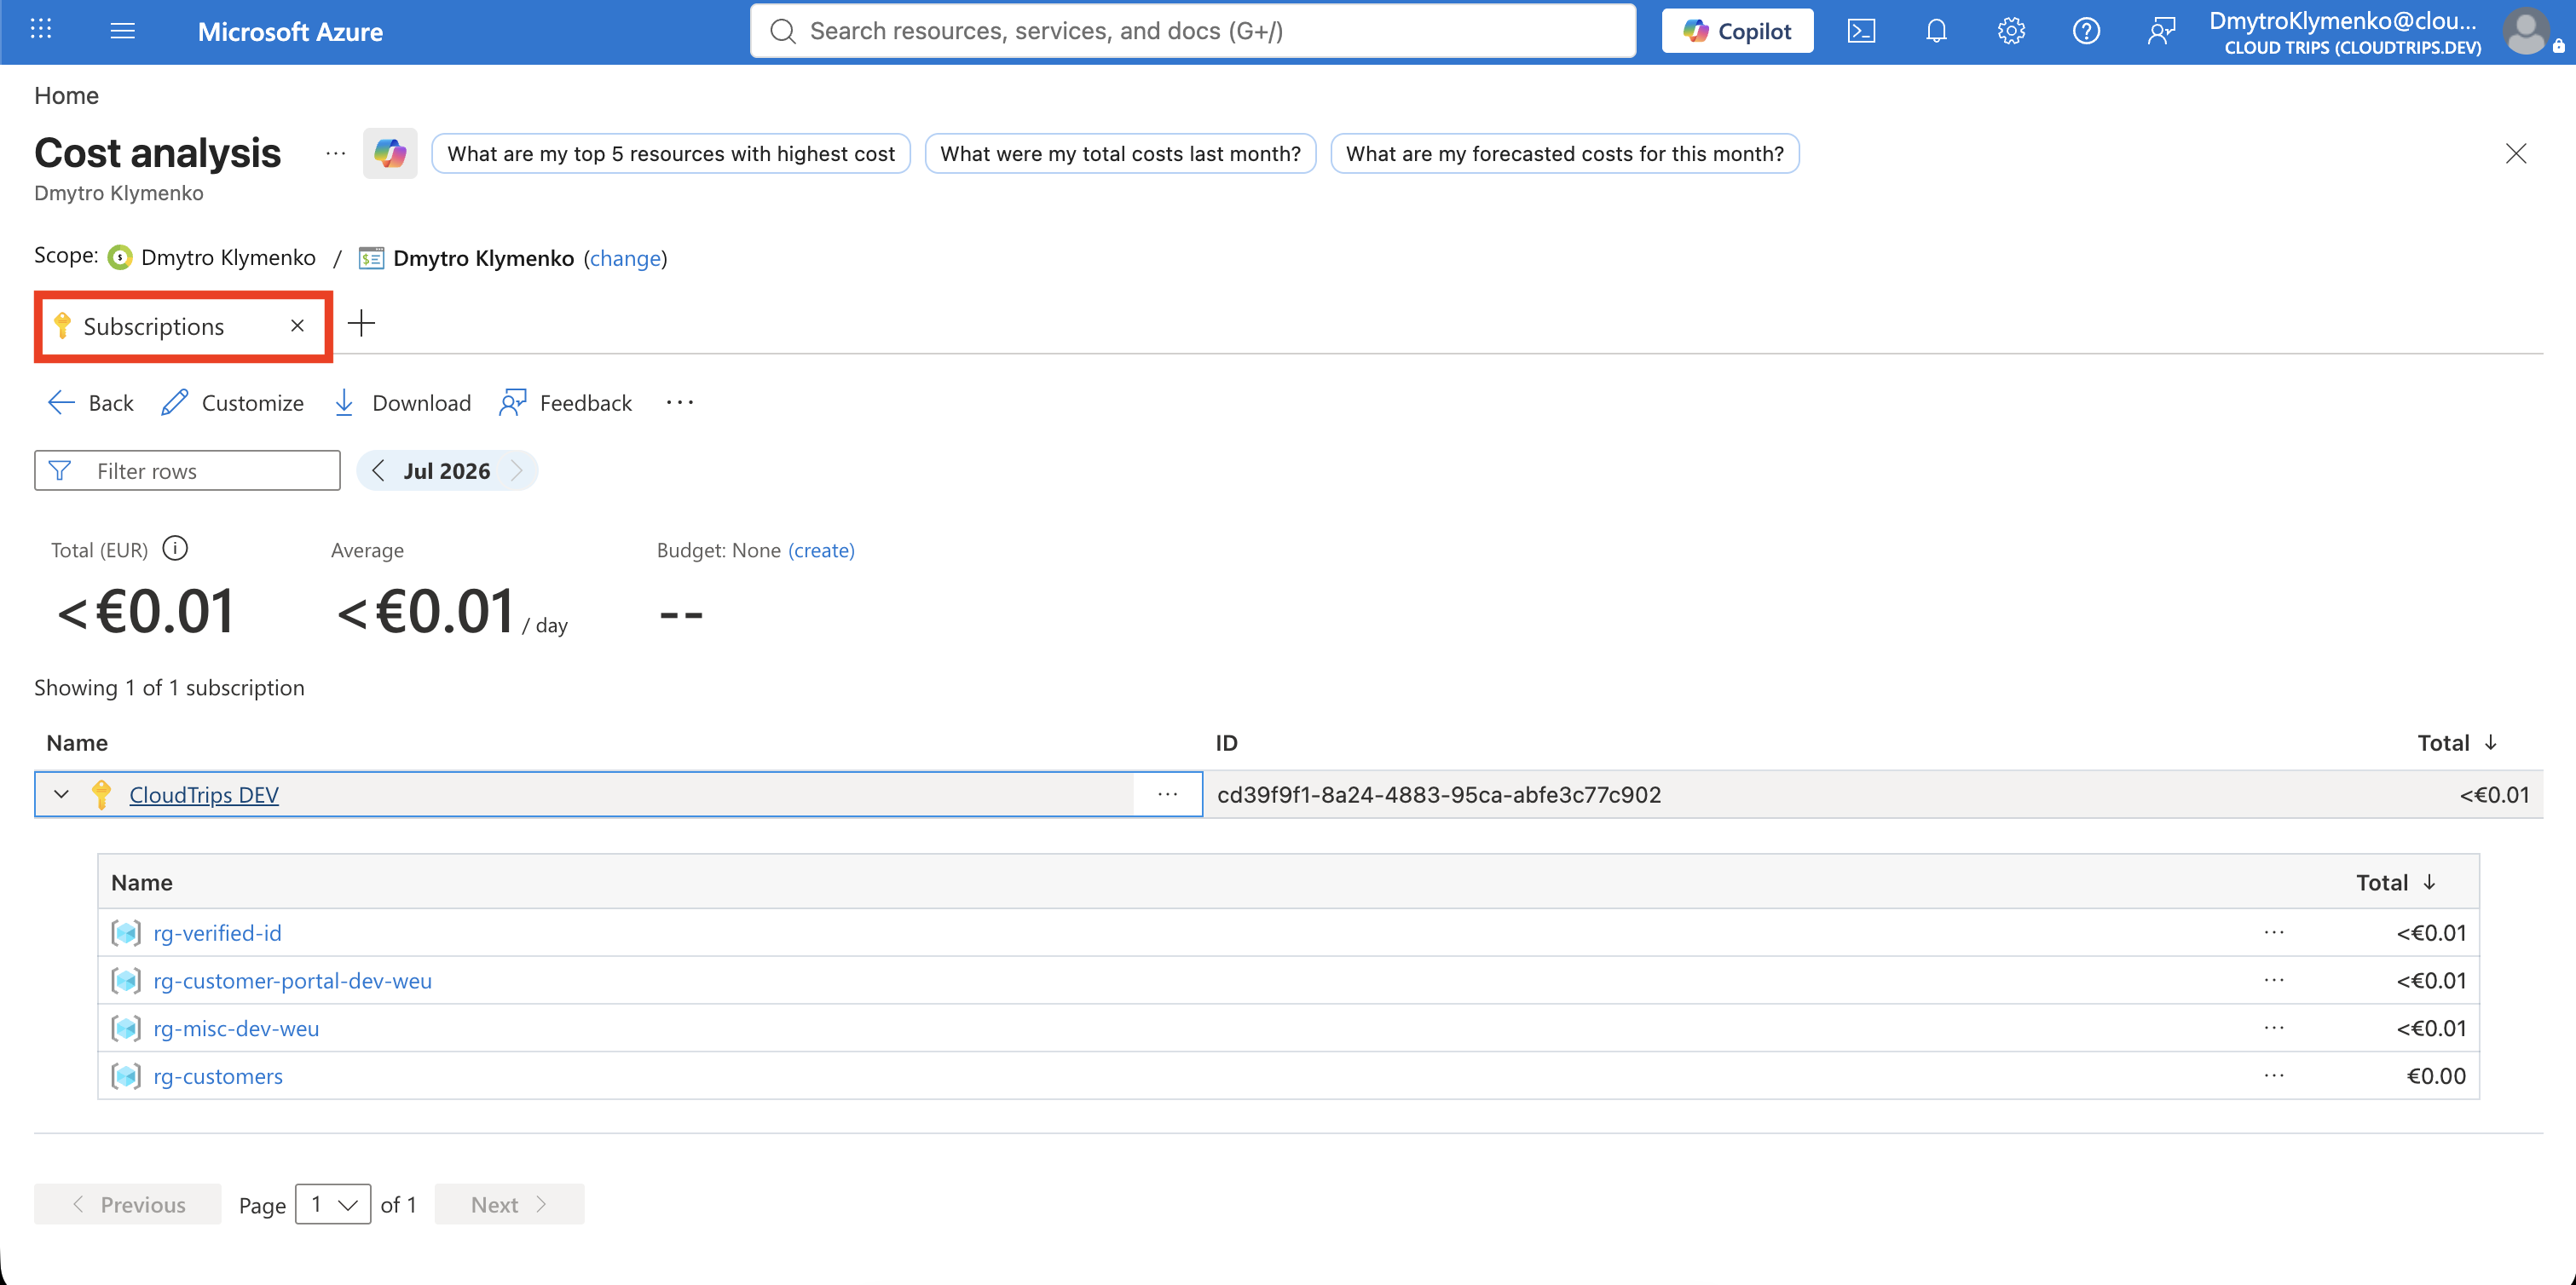
The Subscriptions view under Smart views is useful for exploration, but it cannot be pinned to the Azure dashboard in this portal experience. Use a view under Built-in views for every dashboard tile.
Return to Cost analysis at the same billing-profile scope. Under Built-in views, select Cost by service. Configure:
Date: Last 6 months
Granularity: Monthly
Group by: Subscription name
Filter: CloudTrips DEV
Initially the filter contains only CloudTrips DEV. When CloudTrips TEST appears in Cost Analysis, add it to the filter so that the chart compares both environments.
Do not select Save as because a saved custom view does not provide the pin action. Pin the configured built-in view directly to the existing shared dashboard:
Dashboard: CloudTrips FinOps
Tile purpose: Compare DEV and TEST costs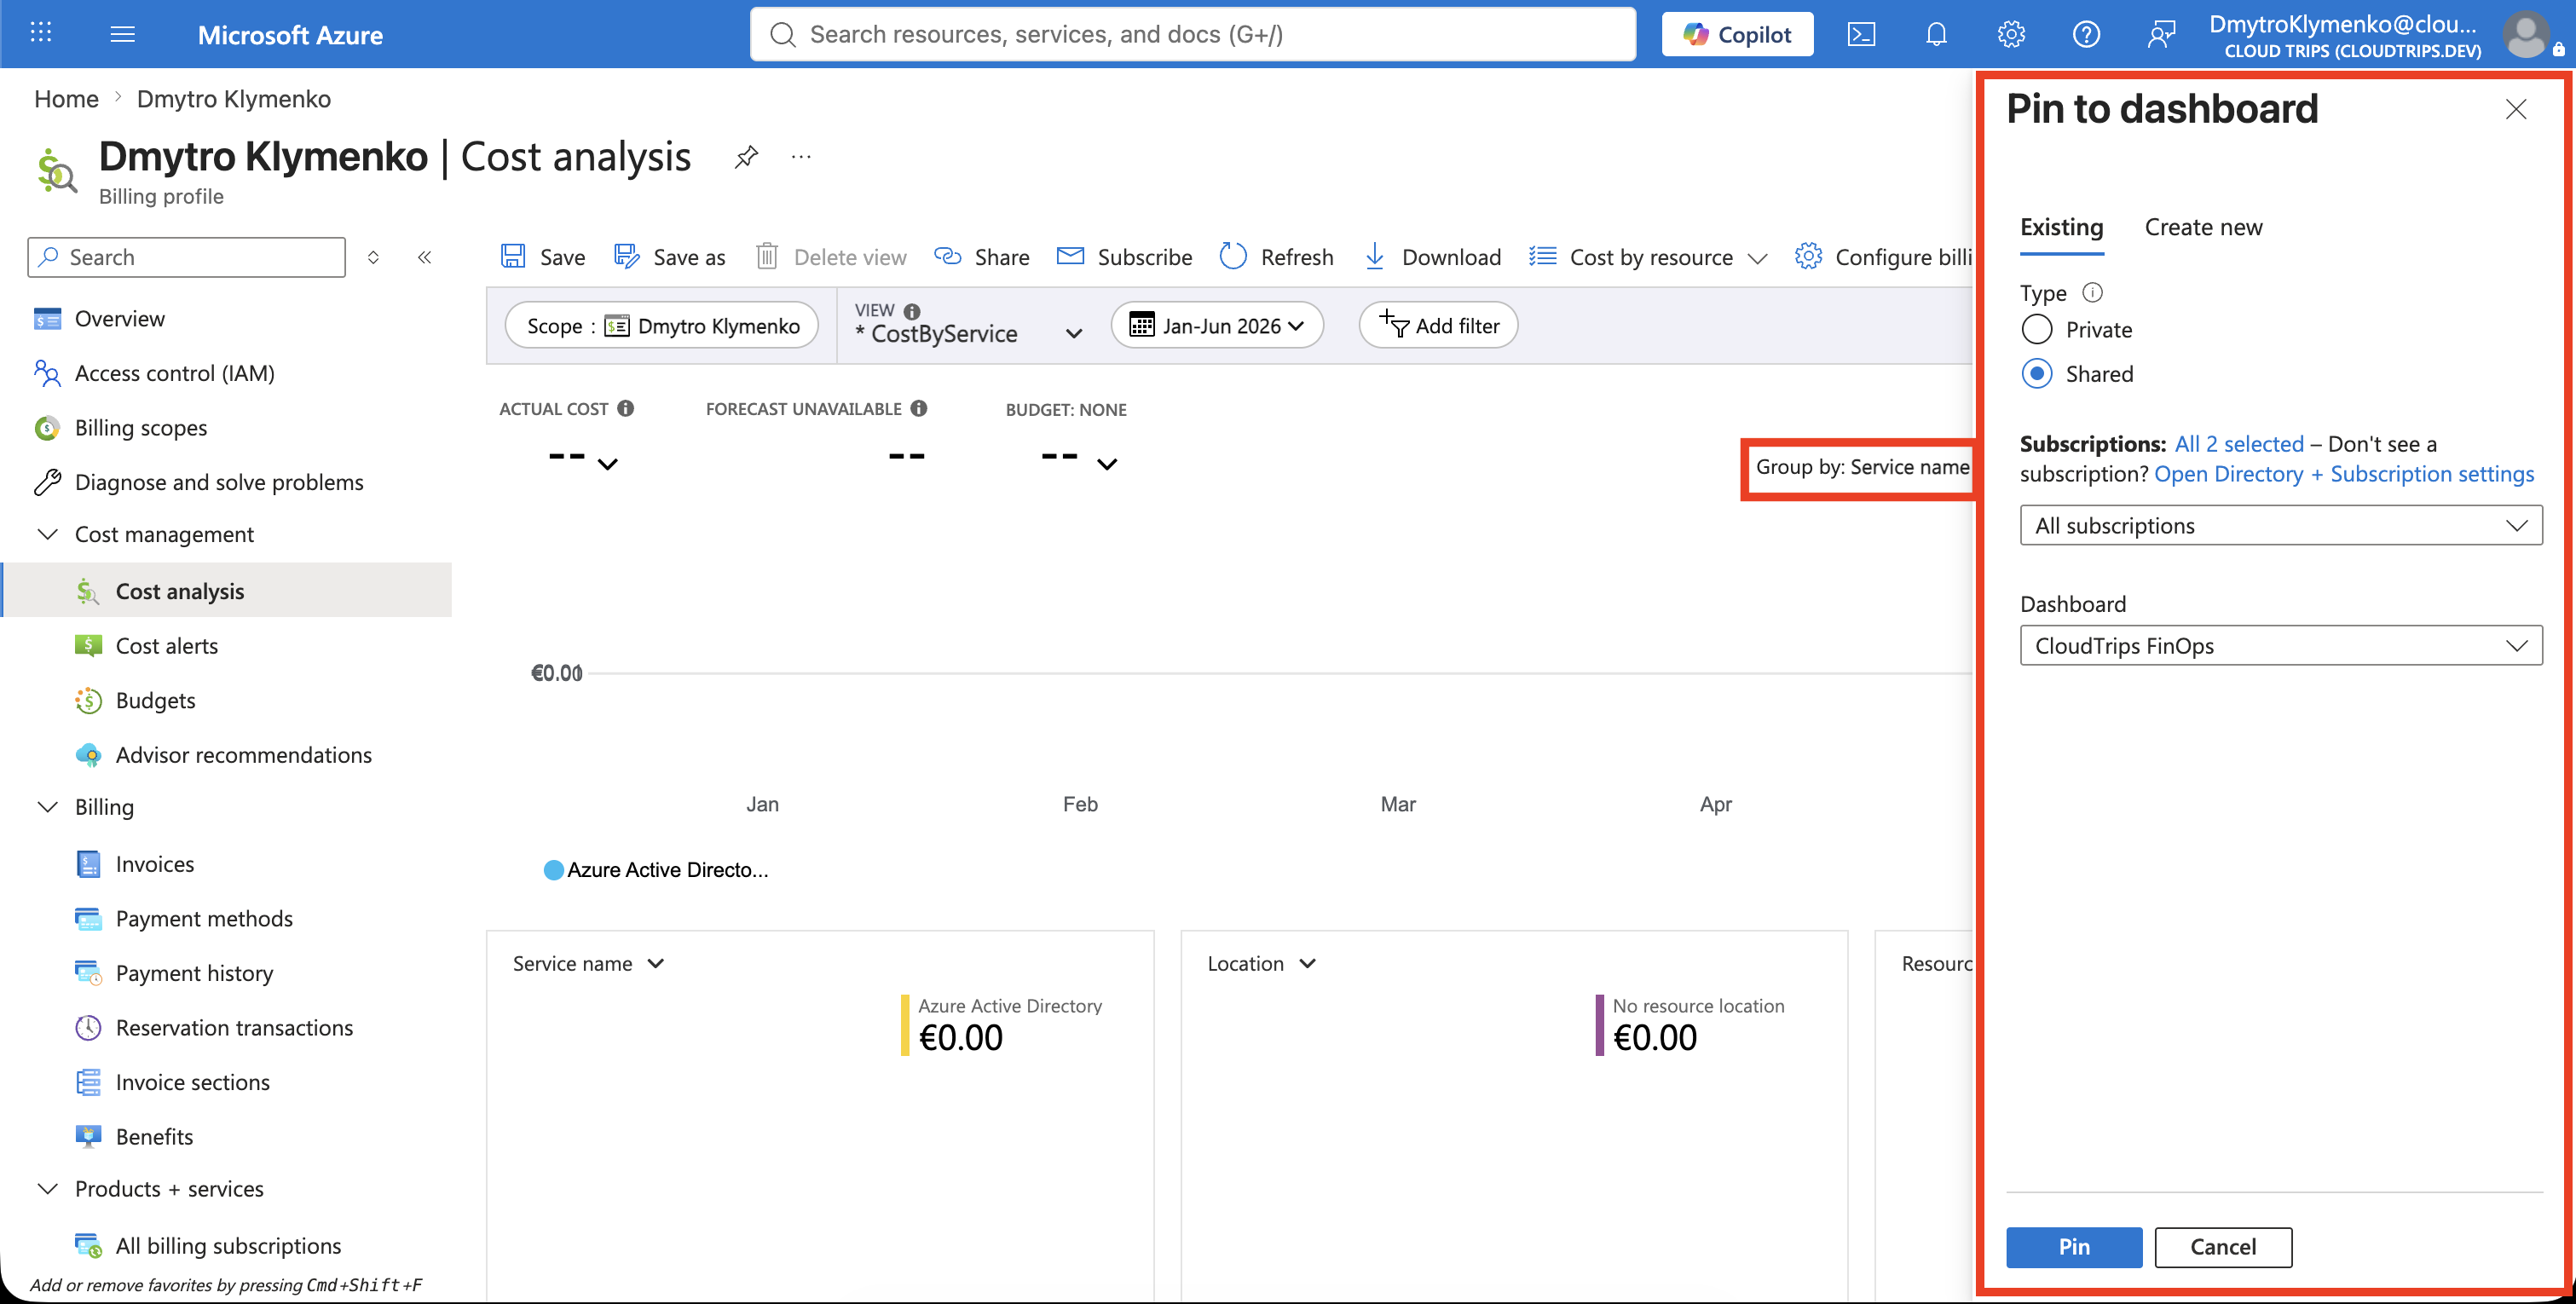
Add the Service Breakdown
The Services view under Smart views also cannot be pinned. Under Built-in views, open Cost by service again and configure:
Date: This month
Granularity: None
Group by: Service name
Filter: CloudTrips DEV
Without saving it as a custom view, pin the configured built-in view directly to the existing CloudTrips FinOps dashboard. Add CloudTrips TEST to the filter later when its cost data becomes available.
The service breakdown identifies whether storage, compute, networking, Key Vault, or another Azure service is driving the current cost. Leadership can use it to ask the appropriate workload owner for more detail.
Arrange and Share the Dashboard
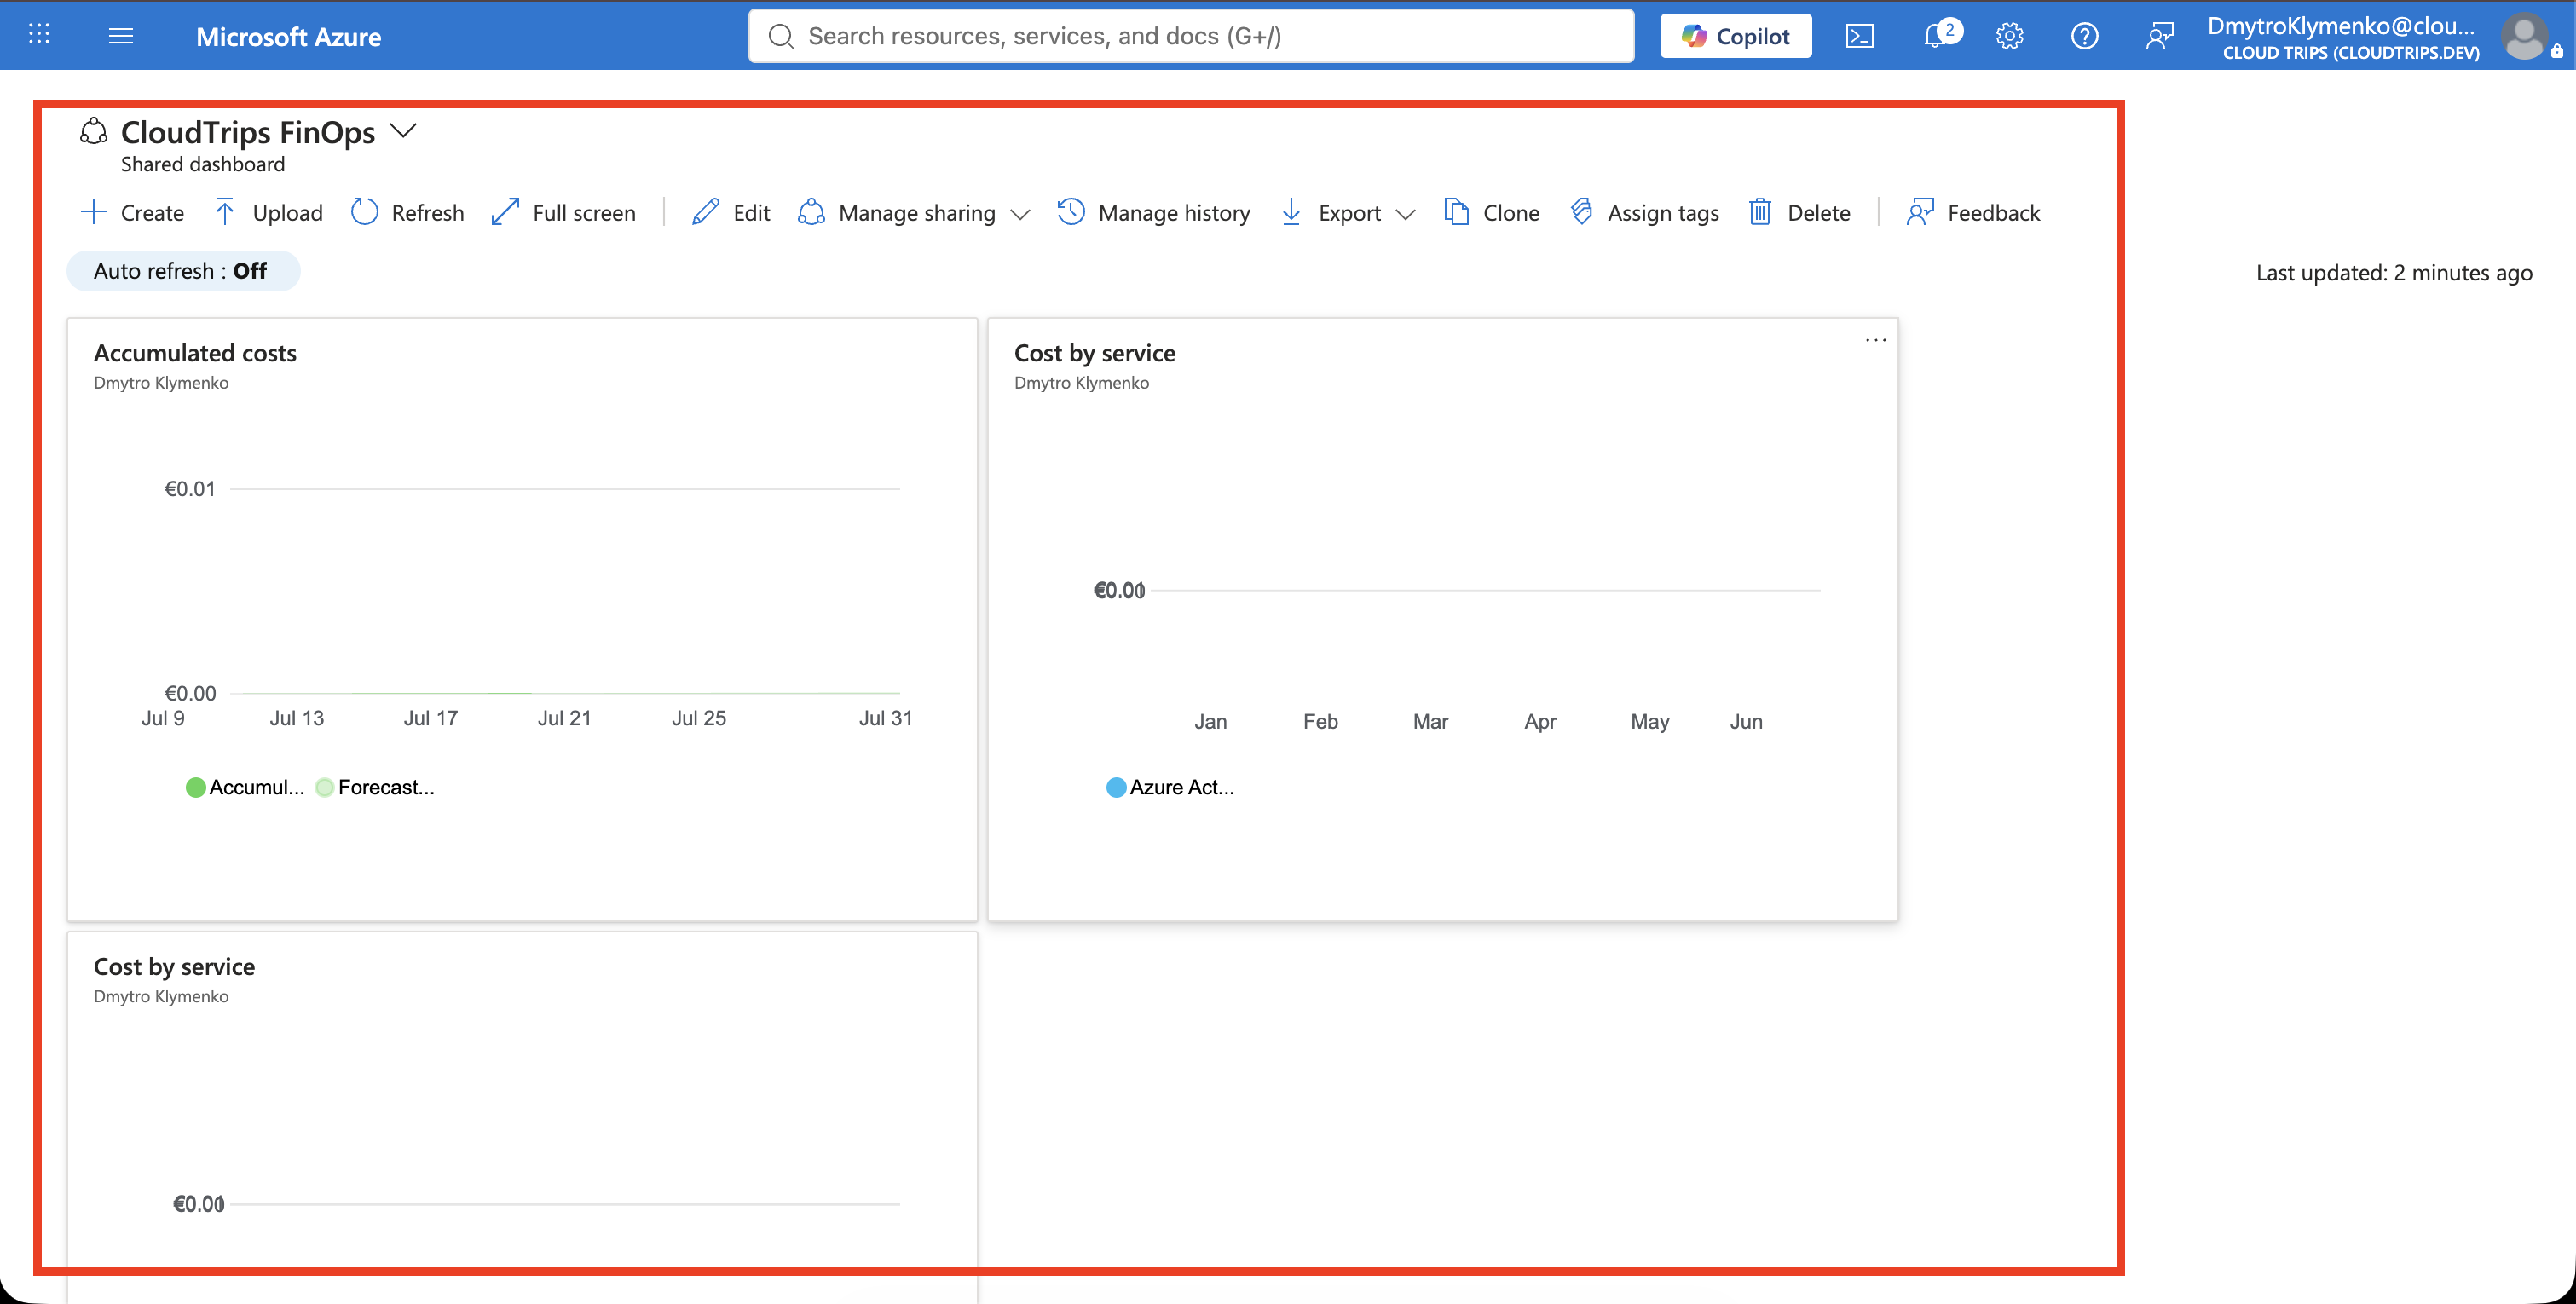
Open Dashboard from the Azure portal menu and select CloudTrips FinOps. Select Edit and arrange the tiles so that:
- current-month accumulated cost is the largest tile at the top
- DEV versus TEST cost is below it
- service cost is beside the environment comparison
Save the layout. If the dashboard is not yet published, select Share, choose CloudTrips DEV, set Resource group location to West Europe, and then select Publish. Leave the default option enabled so Azure creates or uses the dashboards resource group.
Under Manage sharing > Access control, grant the Reader role on the dashboard to the leadership Microsoft Entra group. Also grant those readers cost access at the MCA billing-profile scope. Dashboard access alone does not grant access to the cost data behind each tile.
Verify the Leadership View
Test with a leadership account and confirm:
Dashboard: CloudTrips FinOps opens
Current month: accumulated cost is visible
Environments: CloudTrips DEV is visible; TEST is added after its cost data appears
Services: the largest cost drivers are visible
Tile selection: opens the corresponding Cost Analysis view
If the dashboard opens but a tile shows an access error, the user can read the dashboard resource but cannot read its billing-profile cost scope. Correct the billing access rather than widening access to the CloudTrips DEV subscription unnecessarily.
A pinned tile is a copy of the built-in Cost Analysis view configuration at the time it is pinned. If you later need a different filter or date setting, configure the built-in view again, pin it again, and remove the old tile. Cost data is also not real-time, so use the dashboard for trends and decisions rather than second-by-second monitoring.
CloudTrips leadership now has one shared cost view for the current trend, the DEV-versus-TEST split, and the services responsible for spending.