Resource Metrics Need Notifications? Create a Metric Alert and Action Group
You want Azure to notify you when a metric crosses a threshold. Metrics are numerical measurements over time; an alert rule evaluates them; an action group defines who receives the notification. This lab uses a deliberately low threshold to make a test alert easy to trigger.
Reuse stctmonitorweu, monitor-demo, and rg-cloudtrips-monitor-test-weu from Configure Log Analytics. Use your actual storage account name. Platform metrics are collected automatically. Metric alerts and notification channels can incur charges.
Inspect the Metric
Open Storage account → Monitoring → Metrics. Select the Blob metric namespace; if the scope picker lists services, select blobServices/default.
Metric: Transactions
Aggregation: Sum
Time range: Last hour
Time granularity: 1 minute
Filter: API name = GetBlob
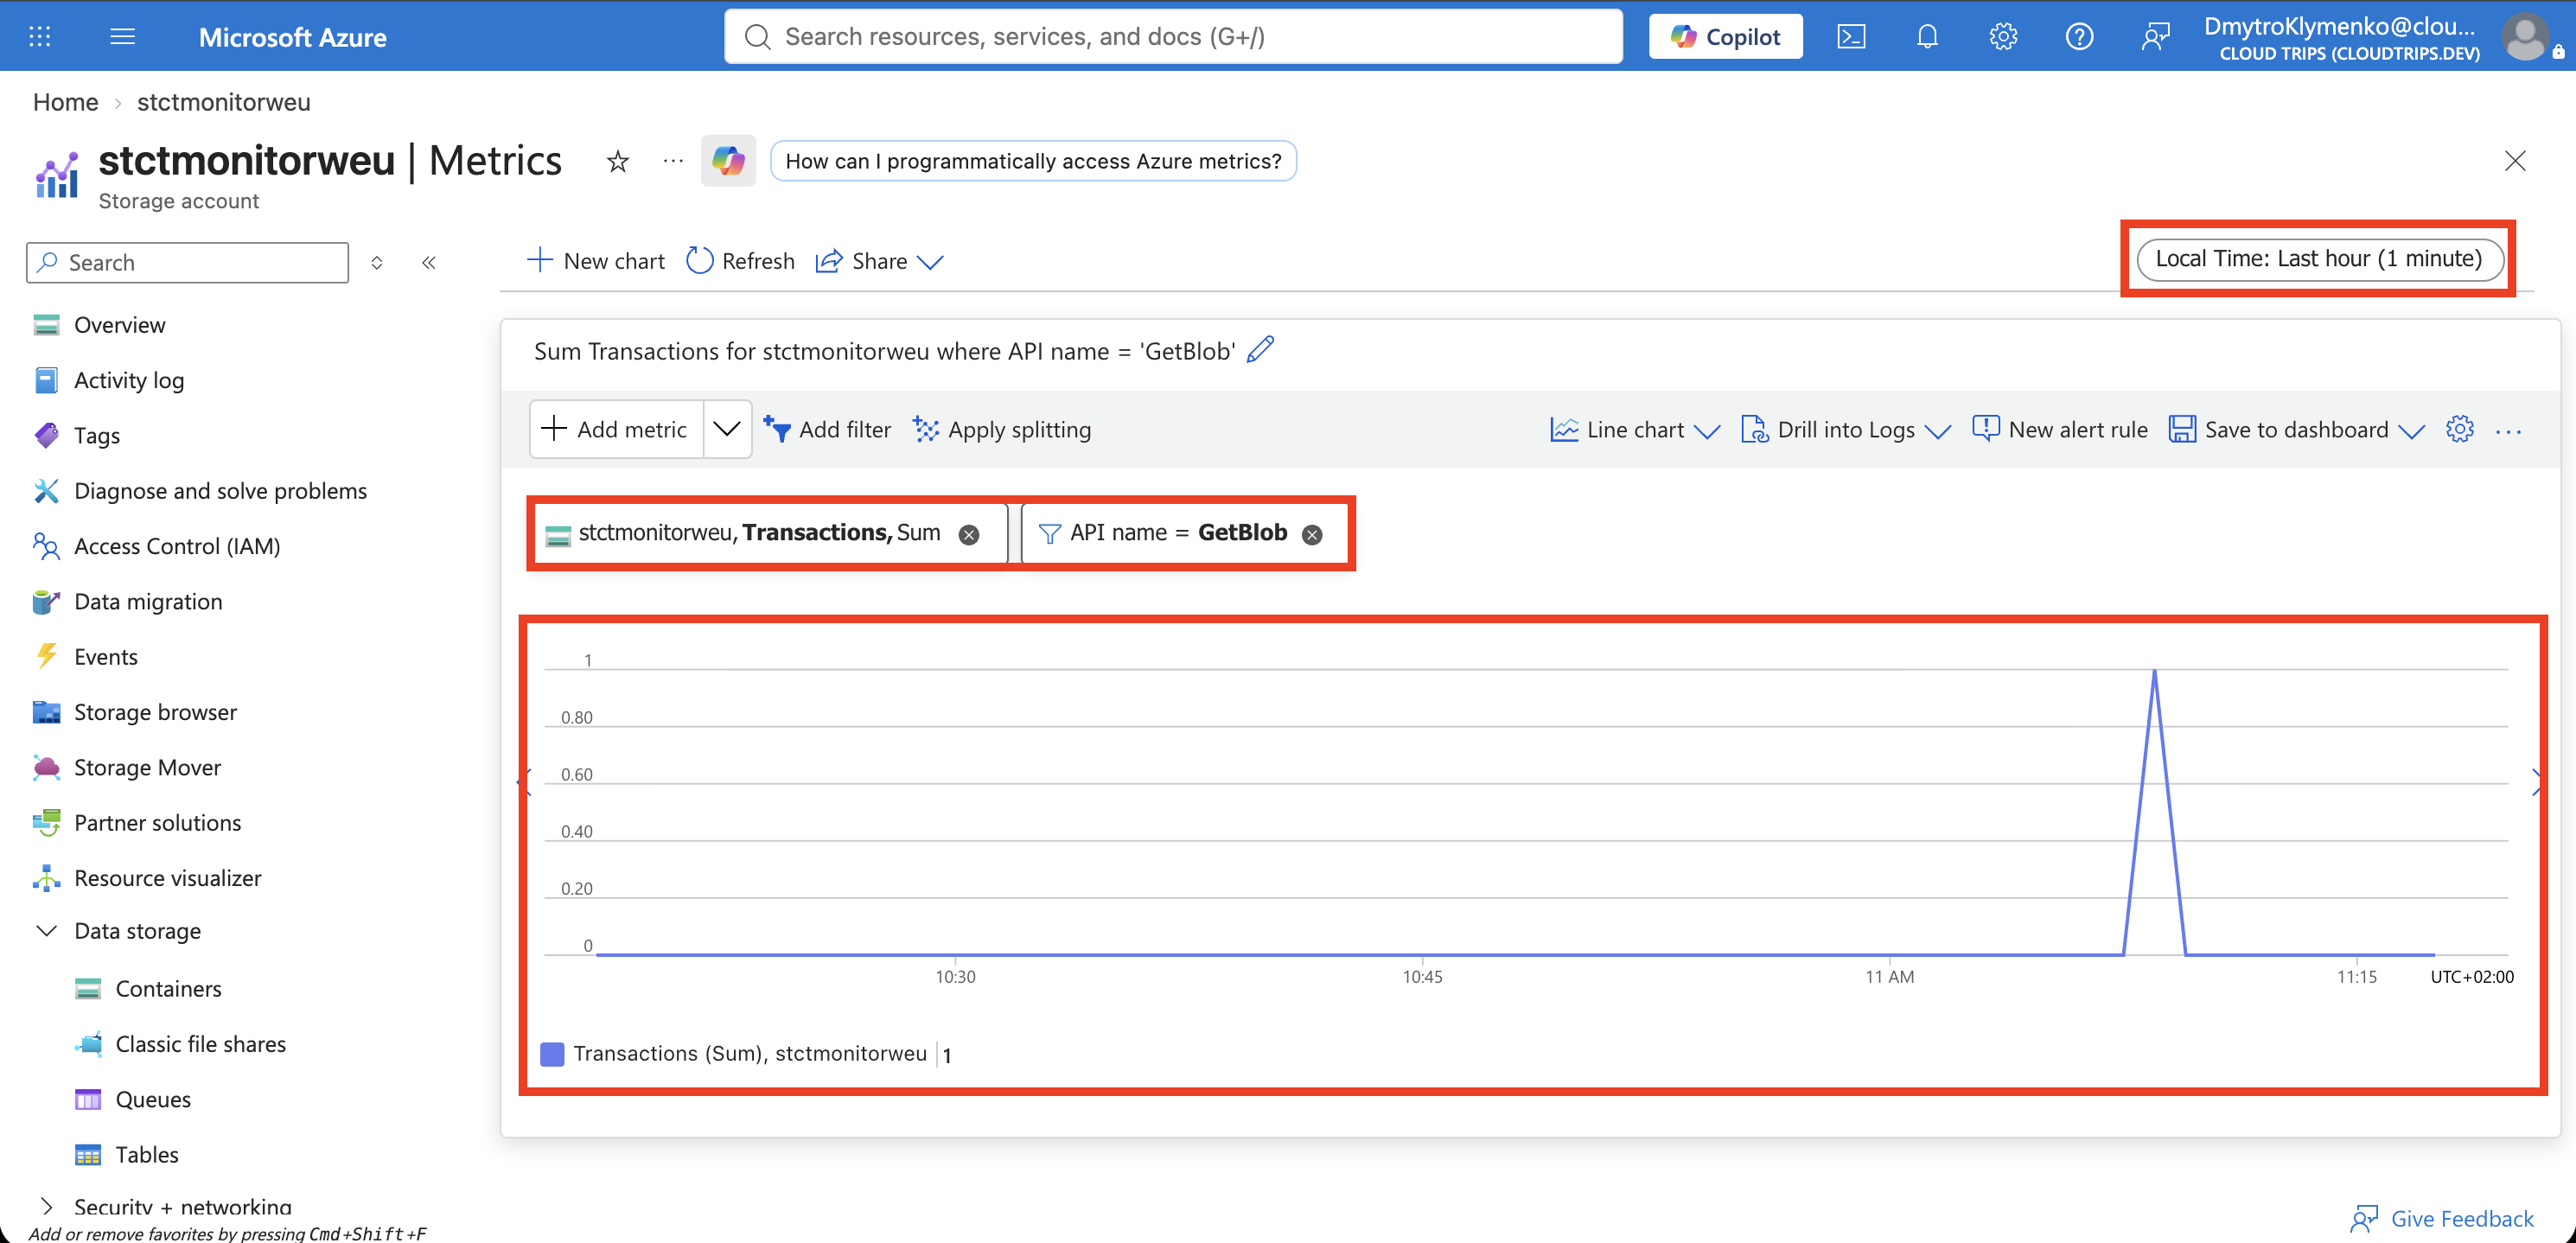
Upload monitor-check.txt to monitor-demo if you deleted it. Download it several times through the portal. Refresh the chart after a few minutes. Sum counts matching requests in each chart interval; a larger interval combines more requests.
Screenshot 1: Blob Transactions chart filtered to GetBlob, with the test downloads visible.
Create the Notification Destination
Open Azure Monitor → Alerts → Action groups → Create:
Resource group: rg-cloudtrips-monitor-test-weu
Action group name: ag-ctmonitor-email
Display name: CTMonitor
Region: Global
Notification type: Email/SMS message/Push/Voice
Notification name: lab-email
Email: your own email address
Common alert schema: Enabled
Select Email in the notification details, save it, and create the group. Open the group, choose Test, select a metric-alert sample, and send the test to lab-email. Check your inbox and spam folder. This verifies the notification channel; the next step verifies metric evaluation.
Create and Trigger the Rule
Return to the filtered metric chart and select New alert rule. Check the scope is the Blob service of your account and configure:
Signal: Transactions
Dimension: API name = GetBlob
Threshold type: Static
Aggregation: Total (Sum)
Operator: Greater than
Threshold: 0
Check every: 1 minute
Lookback period: 5 minutes
Action group: ag-ctmonitor-email
Rule name: al-ctblob-read
Resource group: rg-cloudtrips-monitor-test-weu
Severity: 3 - Informational
Automatically resolve alerts: Enabled
Enable upon creation: Yes
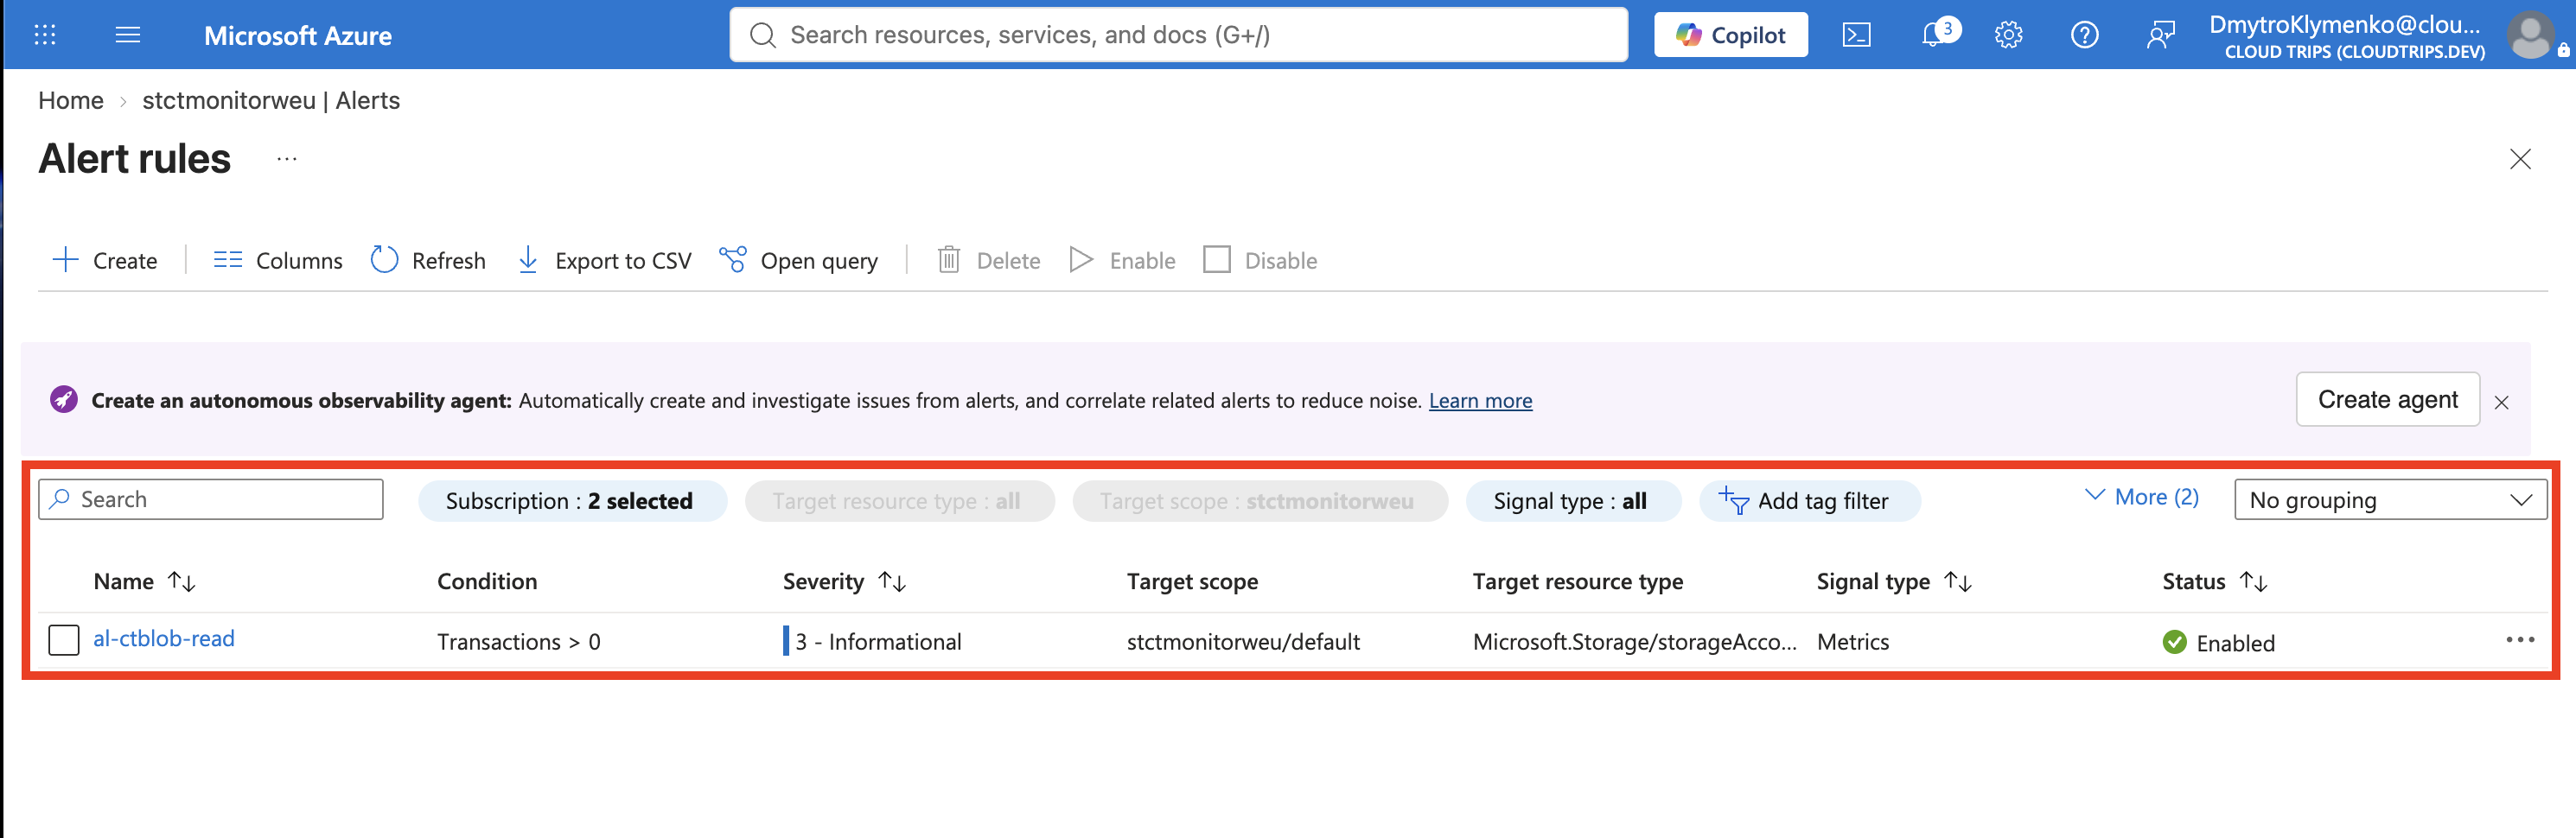
If the wizard shows Aggregation granularity (Period), use 5 minutes. It is the measurement window; 1 minute is how often Azure evaluates that window. Review the displayed cost and create the rule.
Screenshot 2: Saved al-ctblob-read rule showing its scope, GetBlob dimension, threshold, and action group.
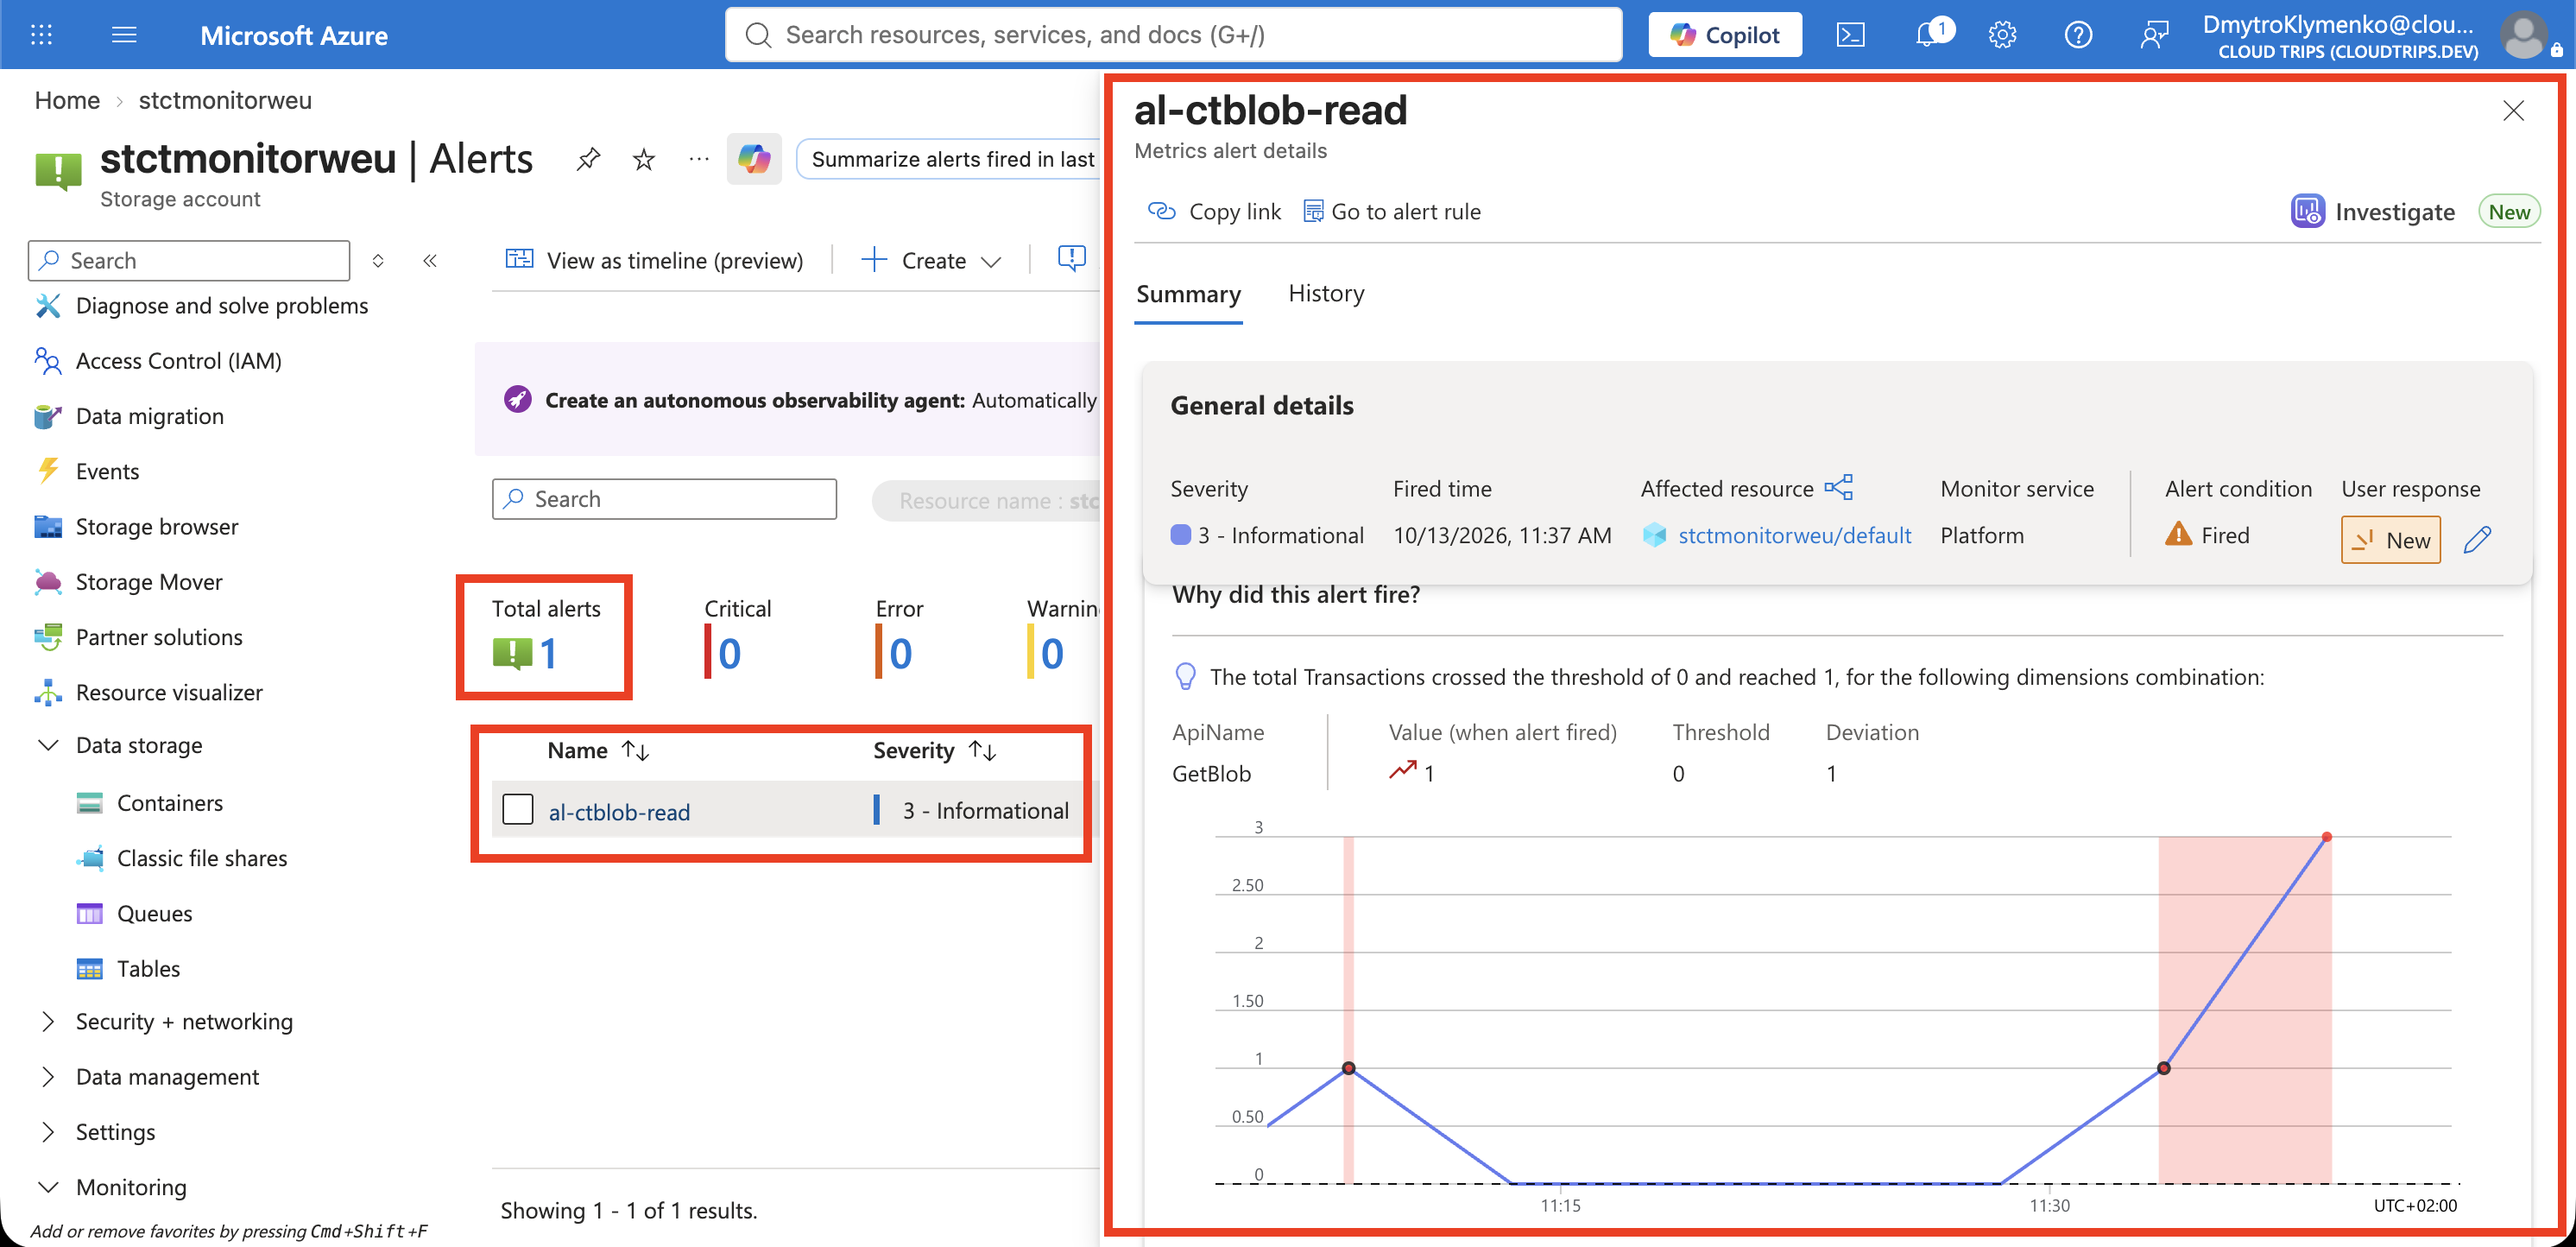
Download the file again after the rule is active. Open Azure Monitor → Alerts, select the storage scope and the last hour, and wait for a Fired alert. Open it and compare the metric value, time, and rule with the notification email.
Screenshot 3: Fired al-ctblob-read alert with the matching email notification available for comparison.
This stateful rule normally sends a notification when it changes to Fired, then resolves after enough healthy evaluations. Repeated downloads while it is already Fired can keep the same alert active. If the action-group test works but no alert fires, check the Blob scope, GetBlob filter, recent downloads, and rule status. An alert processing rule can suppress notifications while an alert still appears.
Finish
Disable al-ctblob-read after testing. Keep the rule, action group, workspace, storage account, and test file for the tuning Trip. A production threshold should represent an operational concern; this threshold is only a repeatable lab trigger.