Resource Logs Need Centralized Analysis? Configure Log Analytics
A file upload or download fails, and you need the request time, operation, and result in one searchable place. In this lab, you collect Blob Storage resource logs and find your own upload, download, and deletion requests.
| Part | What it does |
|---|---|
| Azure Monitor | The monitoring service that brings together logs, metrics, and alerts. |
| Log Analytics workspace | Stores collected logs in tables, with access and retention settings. |
| Diagnostic setting | Chooses which resource log categories to send to the workspace. |
| KQL | Kusto Query Language: filters, selects, and summarizes log records. |
The flow is Blob request → resource log → diagnostic setting → workspace table → KQL results. More resources can send their logs to this workspace as your lab grows.
Use your CloudTrips TEST subscription and its lab Owner account. This trip uses the Azure portal, a new workspace, and a small storage account. Log ingestion, retention, and storage operations can incur usage charges; review Usage and estimated costs in the workspace as you continue the monitoring labs.
Create the Log Analytics Workspace
Open Azure portal → Log Analytics workspaces → Create:
Subscription: CloudTrips TEST
Resource group: rg-cloudtrips-monitor-test-weu (create new)
Name: law-ctmonitorweu
Region: West Europe
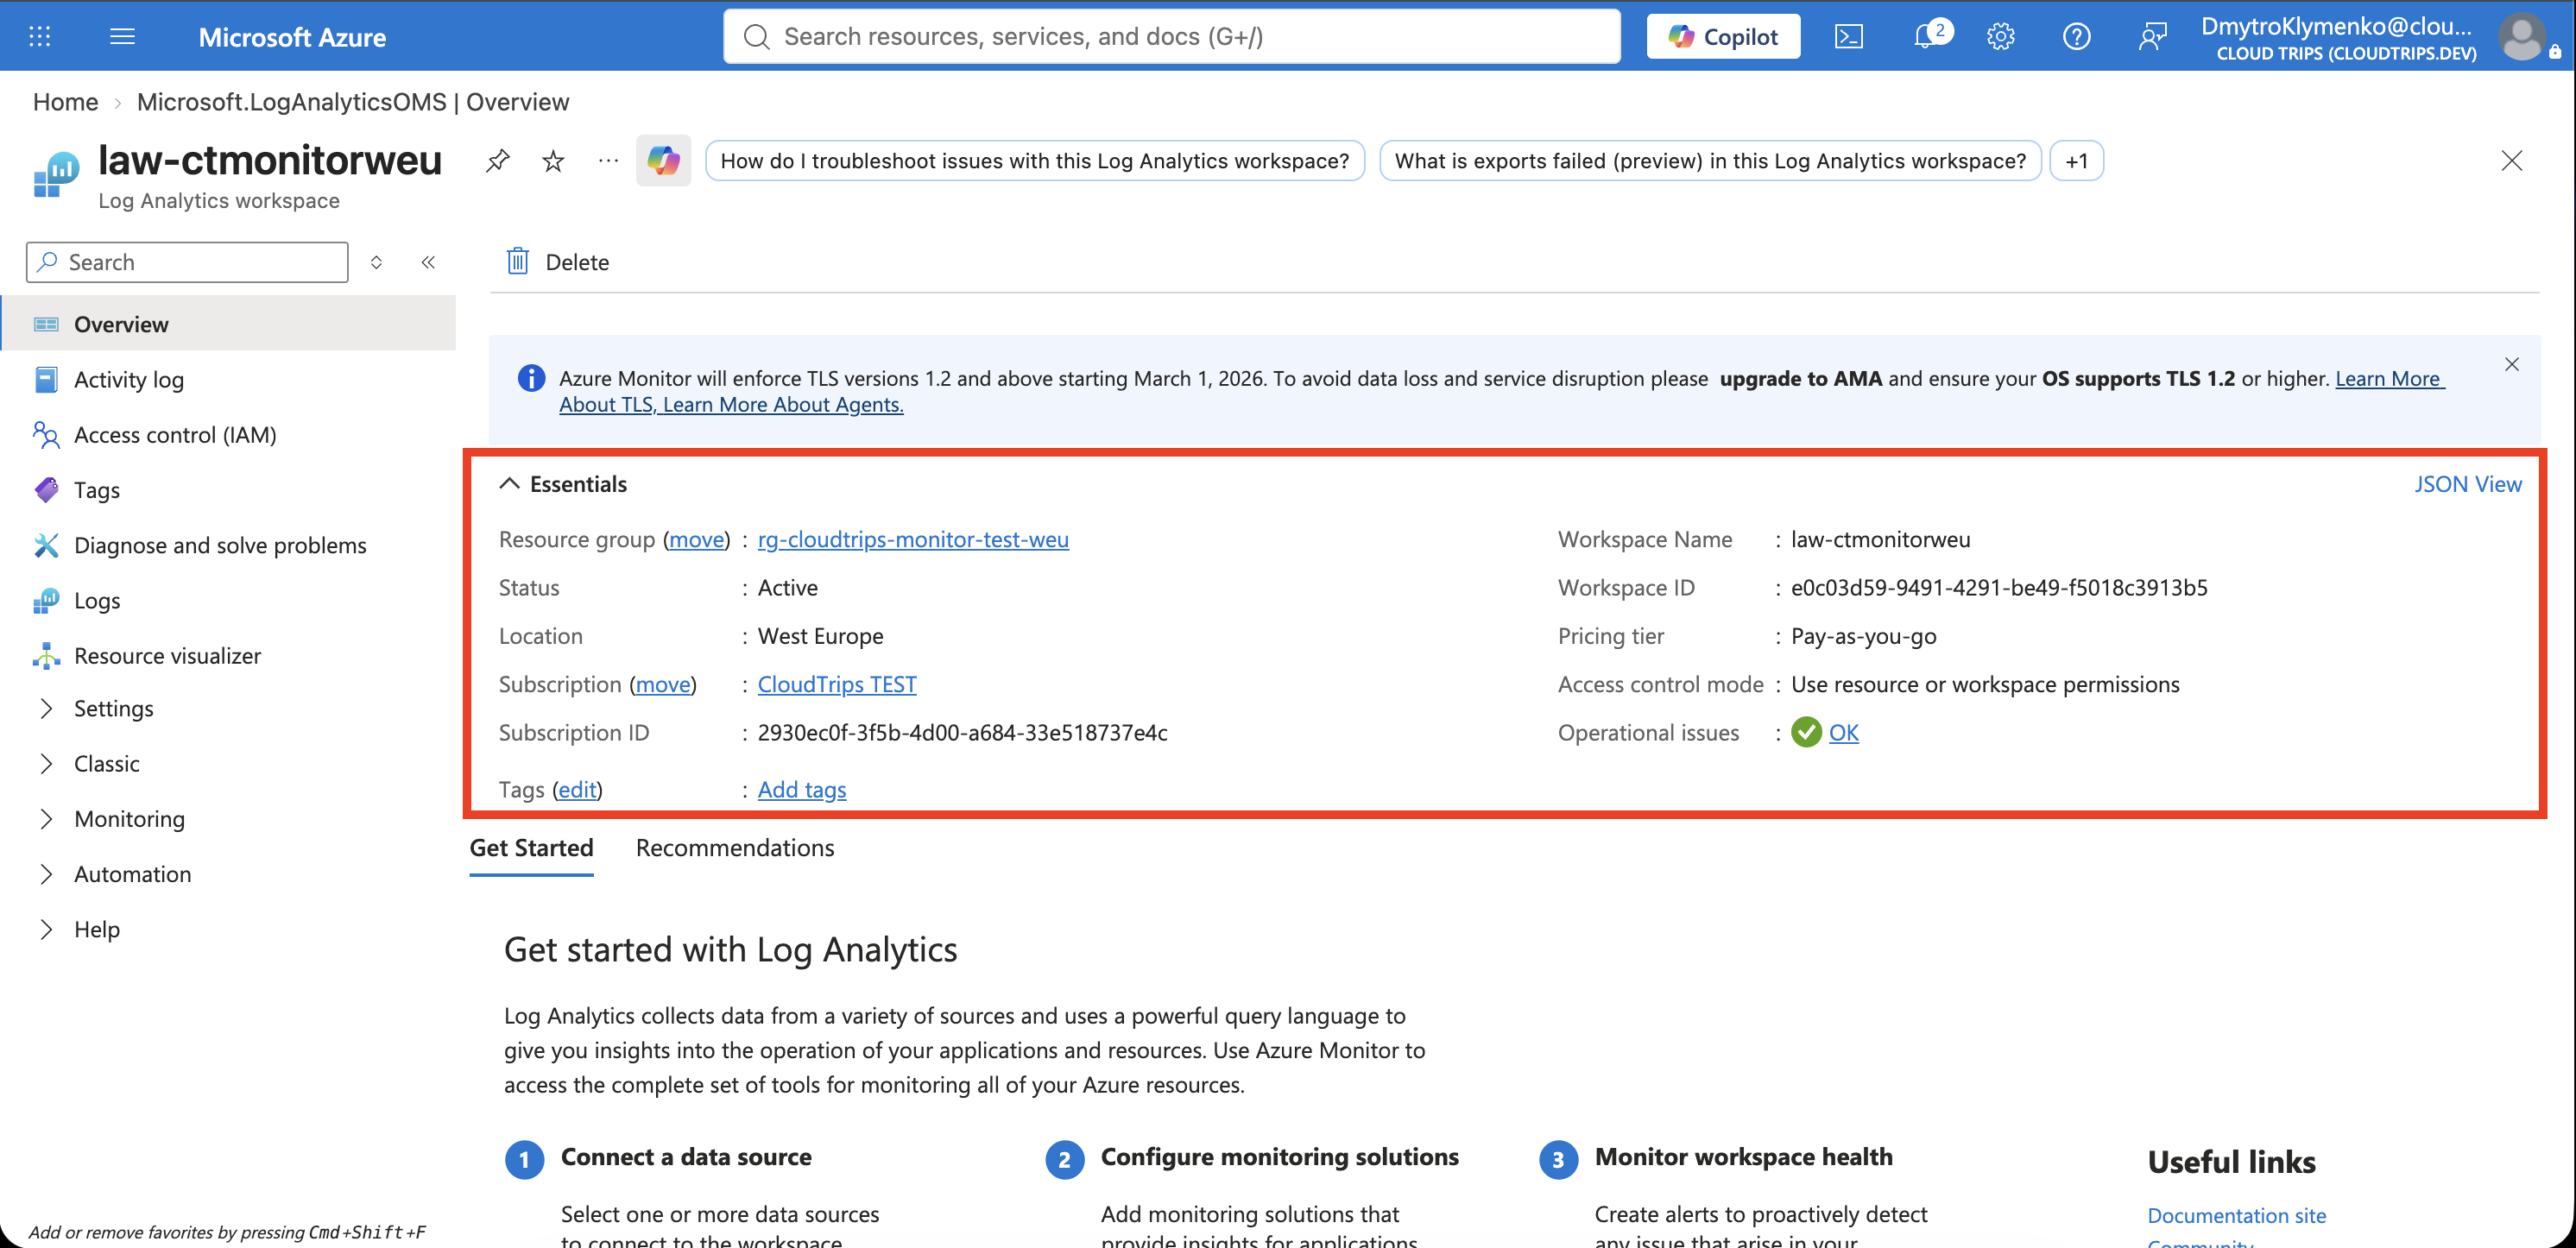
Select Review + create → Create, then open the workspace’s Overview. Confirm its name, resource group, and region. This workspace will be the shared destination for your monitoring labs.
Screenshot 1: Log Analytics workspace Overview showing law-ctmonitorweu in rg-cloudtrips-monitor-test-weu, West Europe.
Connect a Resource’s Logs
Create a small storage account under Storage accounts → Create:
Resource group: rg-cloudtrips-monitor-test-weu
Storage account name: stctmonitorweu (change if taken)
Region: West Europe
Preferred storage type: Blob storage or Azure Data Lake Storage (ADLS) Gen 2
Performance: Standard
Redundancy: Locally-redundant storage (LRS)
Hierarchical namespace: Disabled
Allow storage account key access: Enabled for this lab
Allow Blob anonymous access: Disabled
Public network access: Enabled from all networks for this lab
Review and create the account. Record its actual name; use it in the queries below. The test container will require authenticated access.
Open stctmonitorweu → Monitoring → Diagnostic settings. Select the blob service in the resource list, then Add diagnostic setting.
Diagnostic setting name: blob-to-log-analytics
Logs: StorageRead, StorageWrite, StorageDelete
Destination: Send to Log Analytics workspace
Subscription: CloudTrips TEST
Log Analytics workspace: law-ctmonitorweu
Destination table: Resource specific (if this option appears)
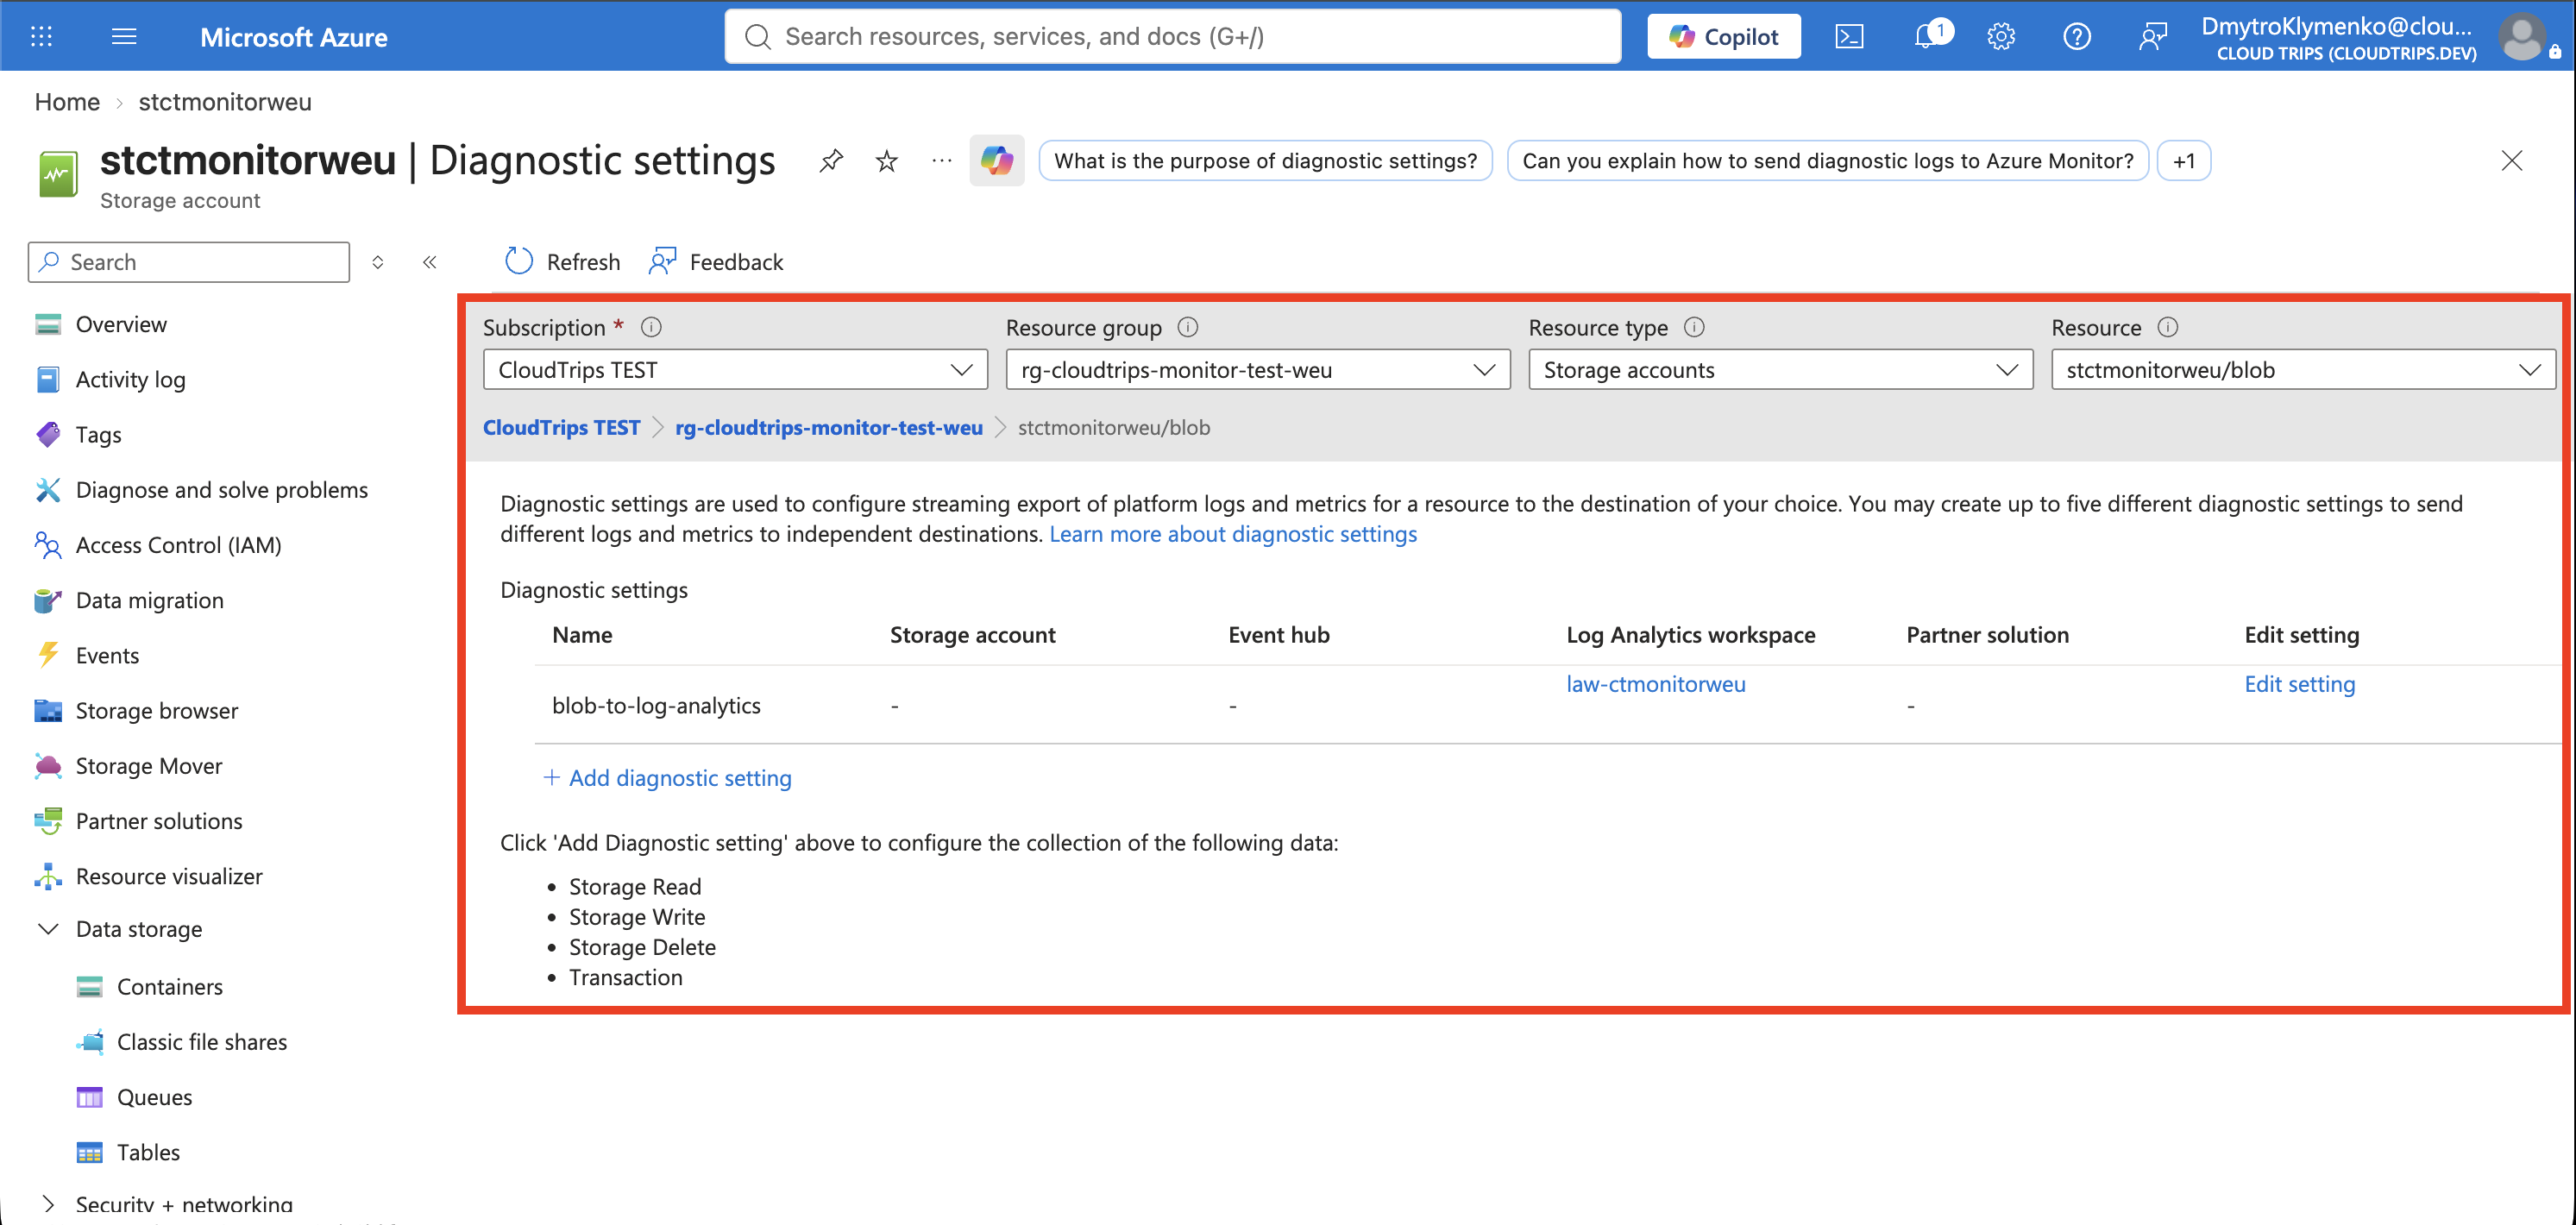
Leave metrics unchecked for this exercise and select Save. Reopen the setting to verify the categories and destination. These three categories feed the StorageBlobLogs table.
Screenshot 2: Saved blob diagnostic setting with StorageRead, StorageWrite, StorageDelete, and law-ctmonitorweu selected as the destination.
Generate Requests and Query Them
After saving the setting, open Data storage → Containers → + Container. Create monitor-demo with Private access. Open it and use Switch to access key if the portal needs an authentication method your lab Owner account can use.
Download monitor-check.txt, then perform these actions in monitor-demo:
- Select Upload and upload the file.
- Select the uploaded blob and Download. Check that the downloaded file opens.
- Delete only monitor-check.txt from the container. Record the time of your test.
These actions generate write, read, and delete requests. The portal can issue additional requests while browsing.
Open Log Analytics workspaces → law-ctmonitorweu → Logs. Close any query-gallery popup, select KQL mode if offered, and set the time range to Last 24 hours. Run this query, replacing the account name if needed:
StorageBlobLogs
| where TimeGenerated > ago(24h)
| where AccountName == "stctmonitorweu"
| where Uri contains "/monitor-demo/monitor-check.txt"
| project TimeGenerated, OperationName, StatusCode,
          StatusText, DurationMs, AuthenticationType, Uri
| order by TimeGenerated desc
Each | passes the results to the next step. where filters records, project selects columns, and order by puts the newest requests first. ago(24h) means the preceding 24 hours at query execution.
Screenshot 3: Workspace Logs showing the KQL query and matching monitor-check.txt requests with operation names, HTTP status codes, and timestamps.
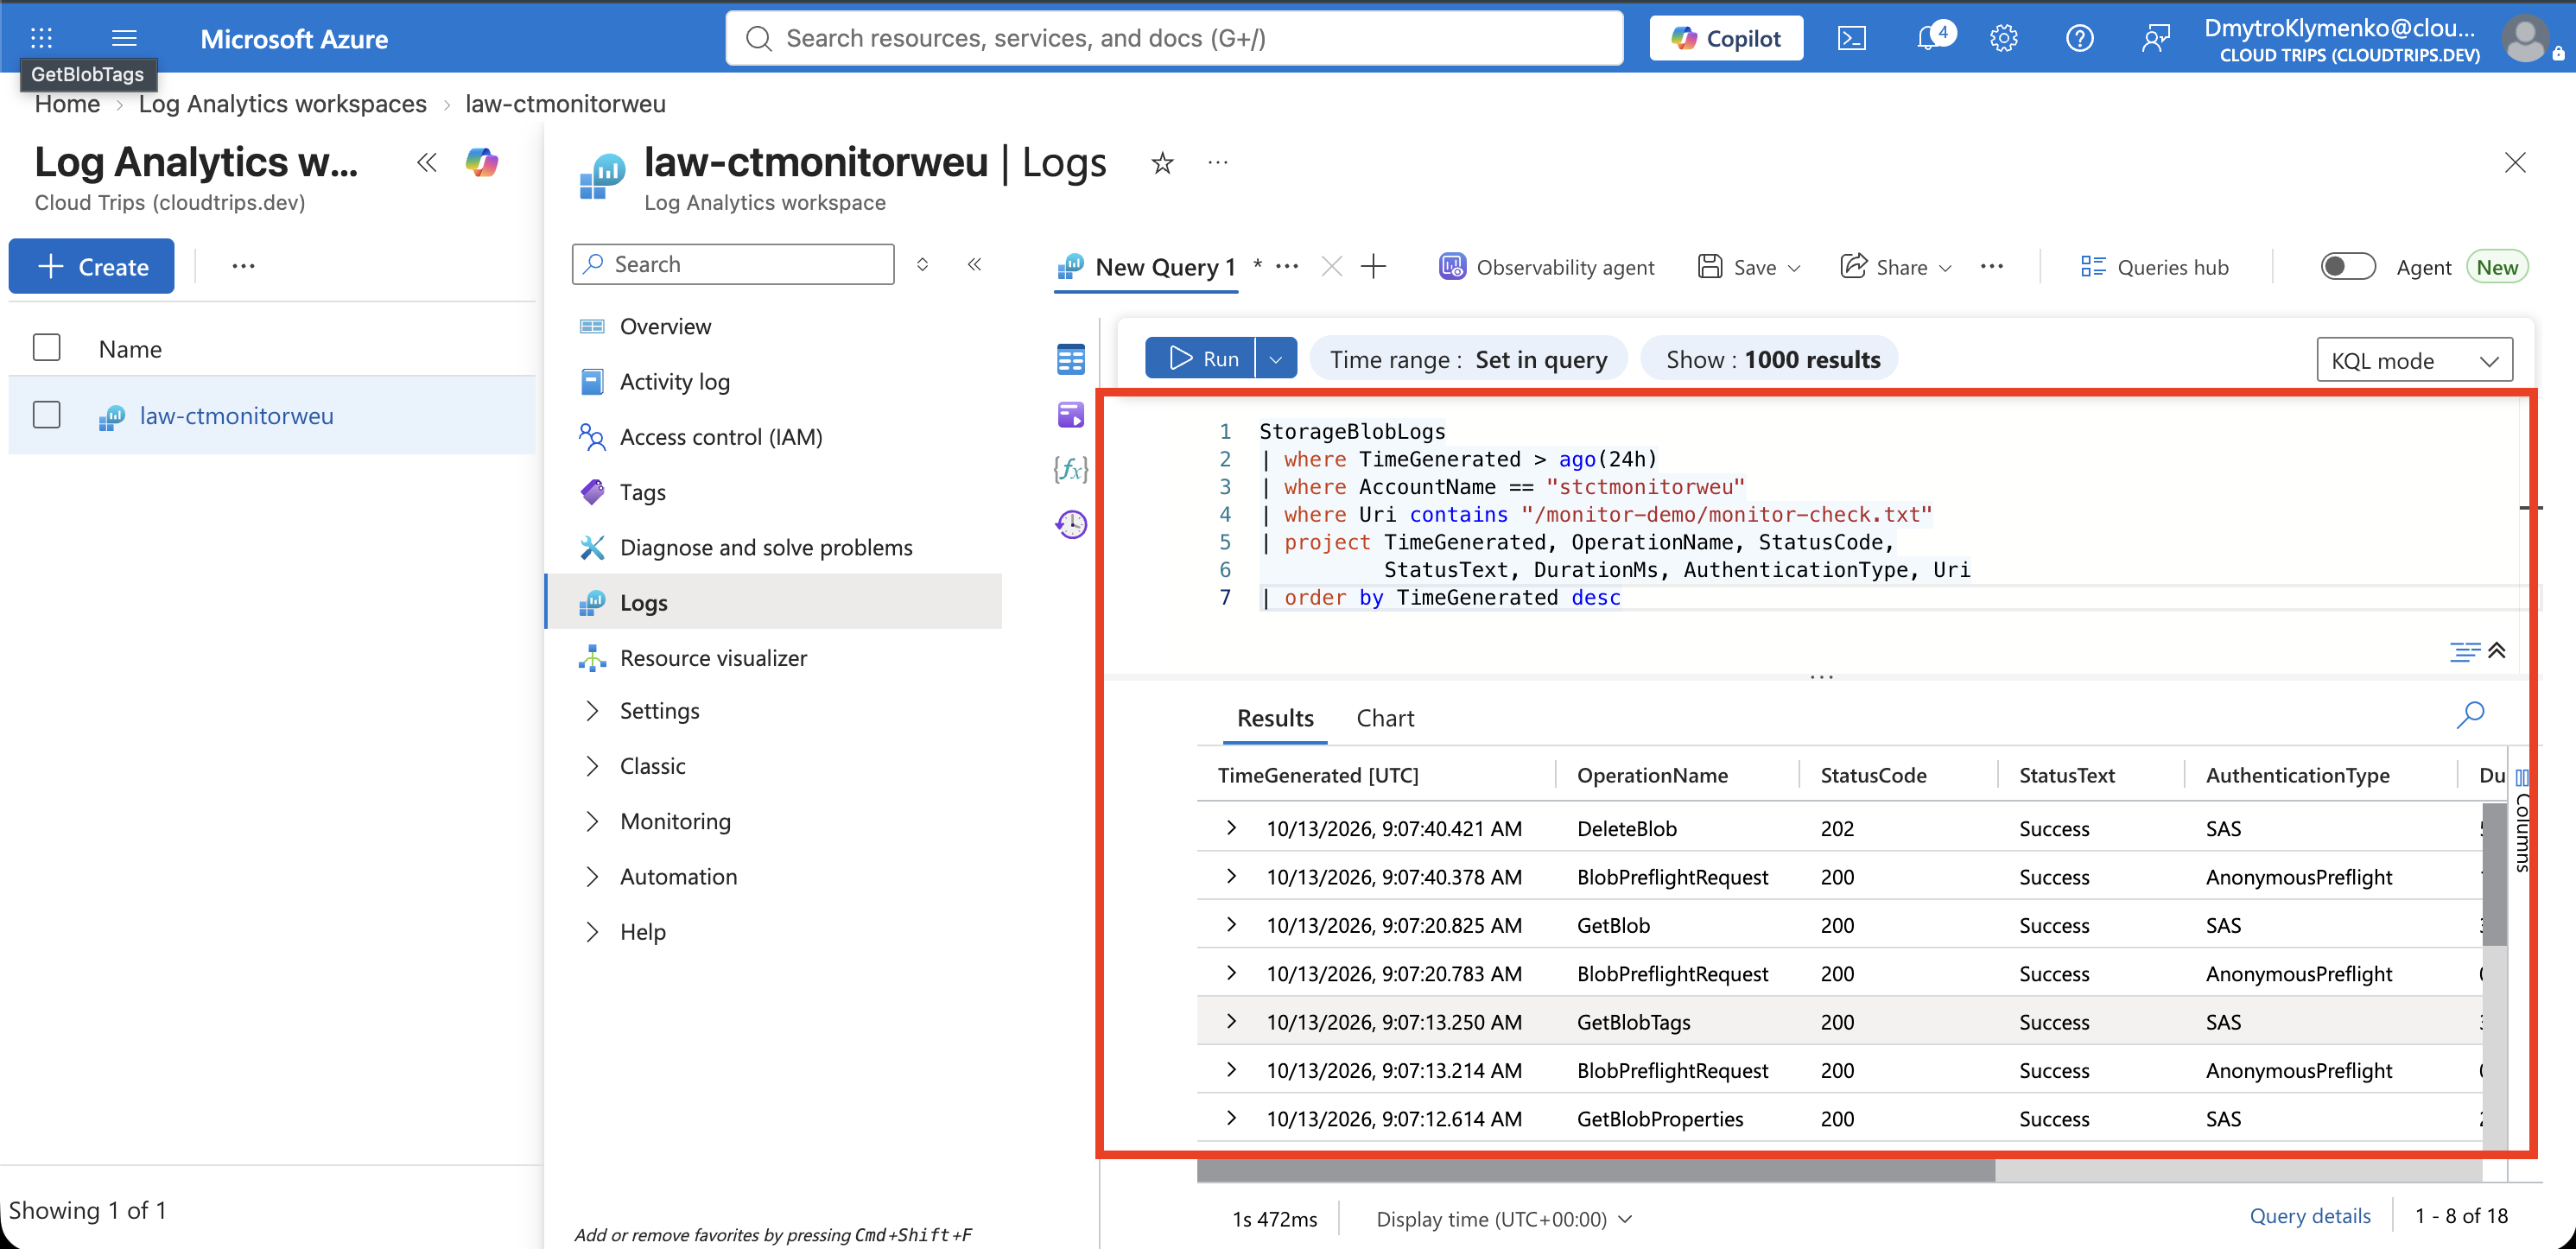
Look for upload operations such as PutBlob or PutBlock / PutBlockList, a download GetBlob, and DeleteBlob. Successful requests have 2xx HTTP status codes. Check the file path and time against your test. DurationMs is the request duration; AuthenticationType shows how the request was authorized. TimeGenerated is stored in UTC, while the portal may display your local time.
To count the recorded requests, run this second query:
StorageBlobLogs
| where TimeGenerated > ago(24h)
| where AccountName == "stctmonitorweu"
| where Uri contains "/monitor-demo/monitor-check.txt"
| summarize Requests = count() by OperationName, StatusCode
| order by Requests desc
summarize groups matching rows and count() counts them. Several requests can belong to one portal action, so expect request counts rather than exactly three rows.
If the Table or Results Are Missing
Initial collection can take up to 90 minutes after creating the diagnostic setting. Azure creates the table when the first records arrive. Check that the setting is saved on blob, points to law-ctmonitorweu, and includes all three categories. Repeat the upload, download, and deletion after collection has had time to start.
If the table exists but the query returns no rows, temporarily remove the Uri filter and confirm the actual AccountName, file path, and time range. Expand both the portal time range and ago(24h) when investigating an older test.
Finish
Your success check is a matching file path with the expected operations and results in law-ctmonitorweu. Keep the workspace and storage account for the next monitoring Trips. To pause collection, delete blob-to-log-analytics; stored logs remain subject to retention. To remove this whole lab, delete that setting first, then rg-cloudtrips-monitor-test-weu once you have finished using its resources.