Operations Need Visual Reports? Create a Workbook and Azure Dashboard
You want a repeatable view of operations rather than retyping the same query. A workbook combines queries and visualizations; an Azure dashboard brings selected views onto one portal page.
Reuse law-ctmonitorweu and the Blob logs from Configure Log Analytics. Generate fresh uploads and downloads if your test data is older than one day.
Build the Report
Open Azure Monitor → Workbooks → New, enter Edit mode, and remove the starter examples. Select Add → Add data source + visualization; some portal versions label this Add query.
Data source: Logs (Analytics)
Resource type: Log Analytics
Workspace: law-ctmonitorweu
Time range: Last 24 hours
Visualization: Grid
Run:
StorageBlobLogs
| where TimeGenerated > ago(24h)
| where AccountName == "stctmonitorweu"
| project TimeGenerated, OperationName, StatusCode, DurationMs, Uri
| top 20 by TimeGenerated desc
Use your actual storage name. Select Done editing for this item. Add a second query with the same source, workspace, and time range:
StorageBlobLogs
| where TimeGenerated > ago(24h)
| where AccountName == "stctmonitorweu"
| summarize Requests = count() by OperationName
| order by Requests desc
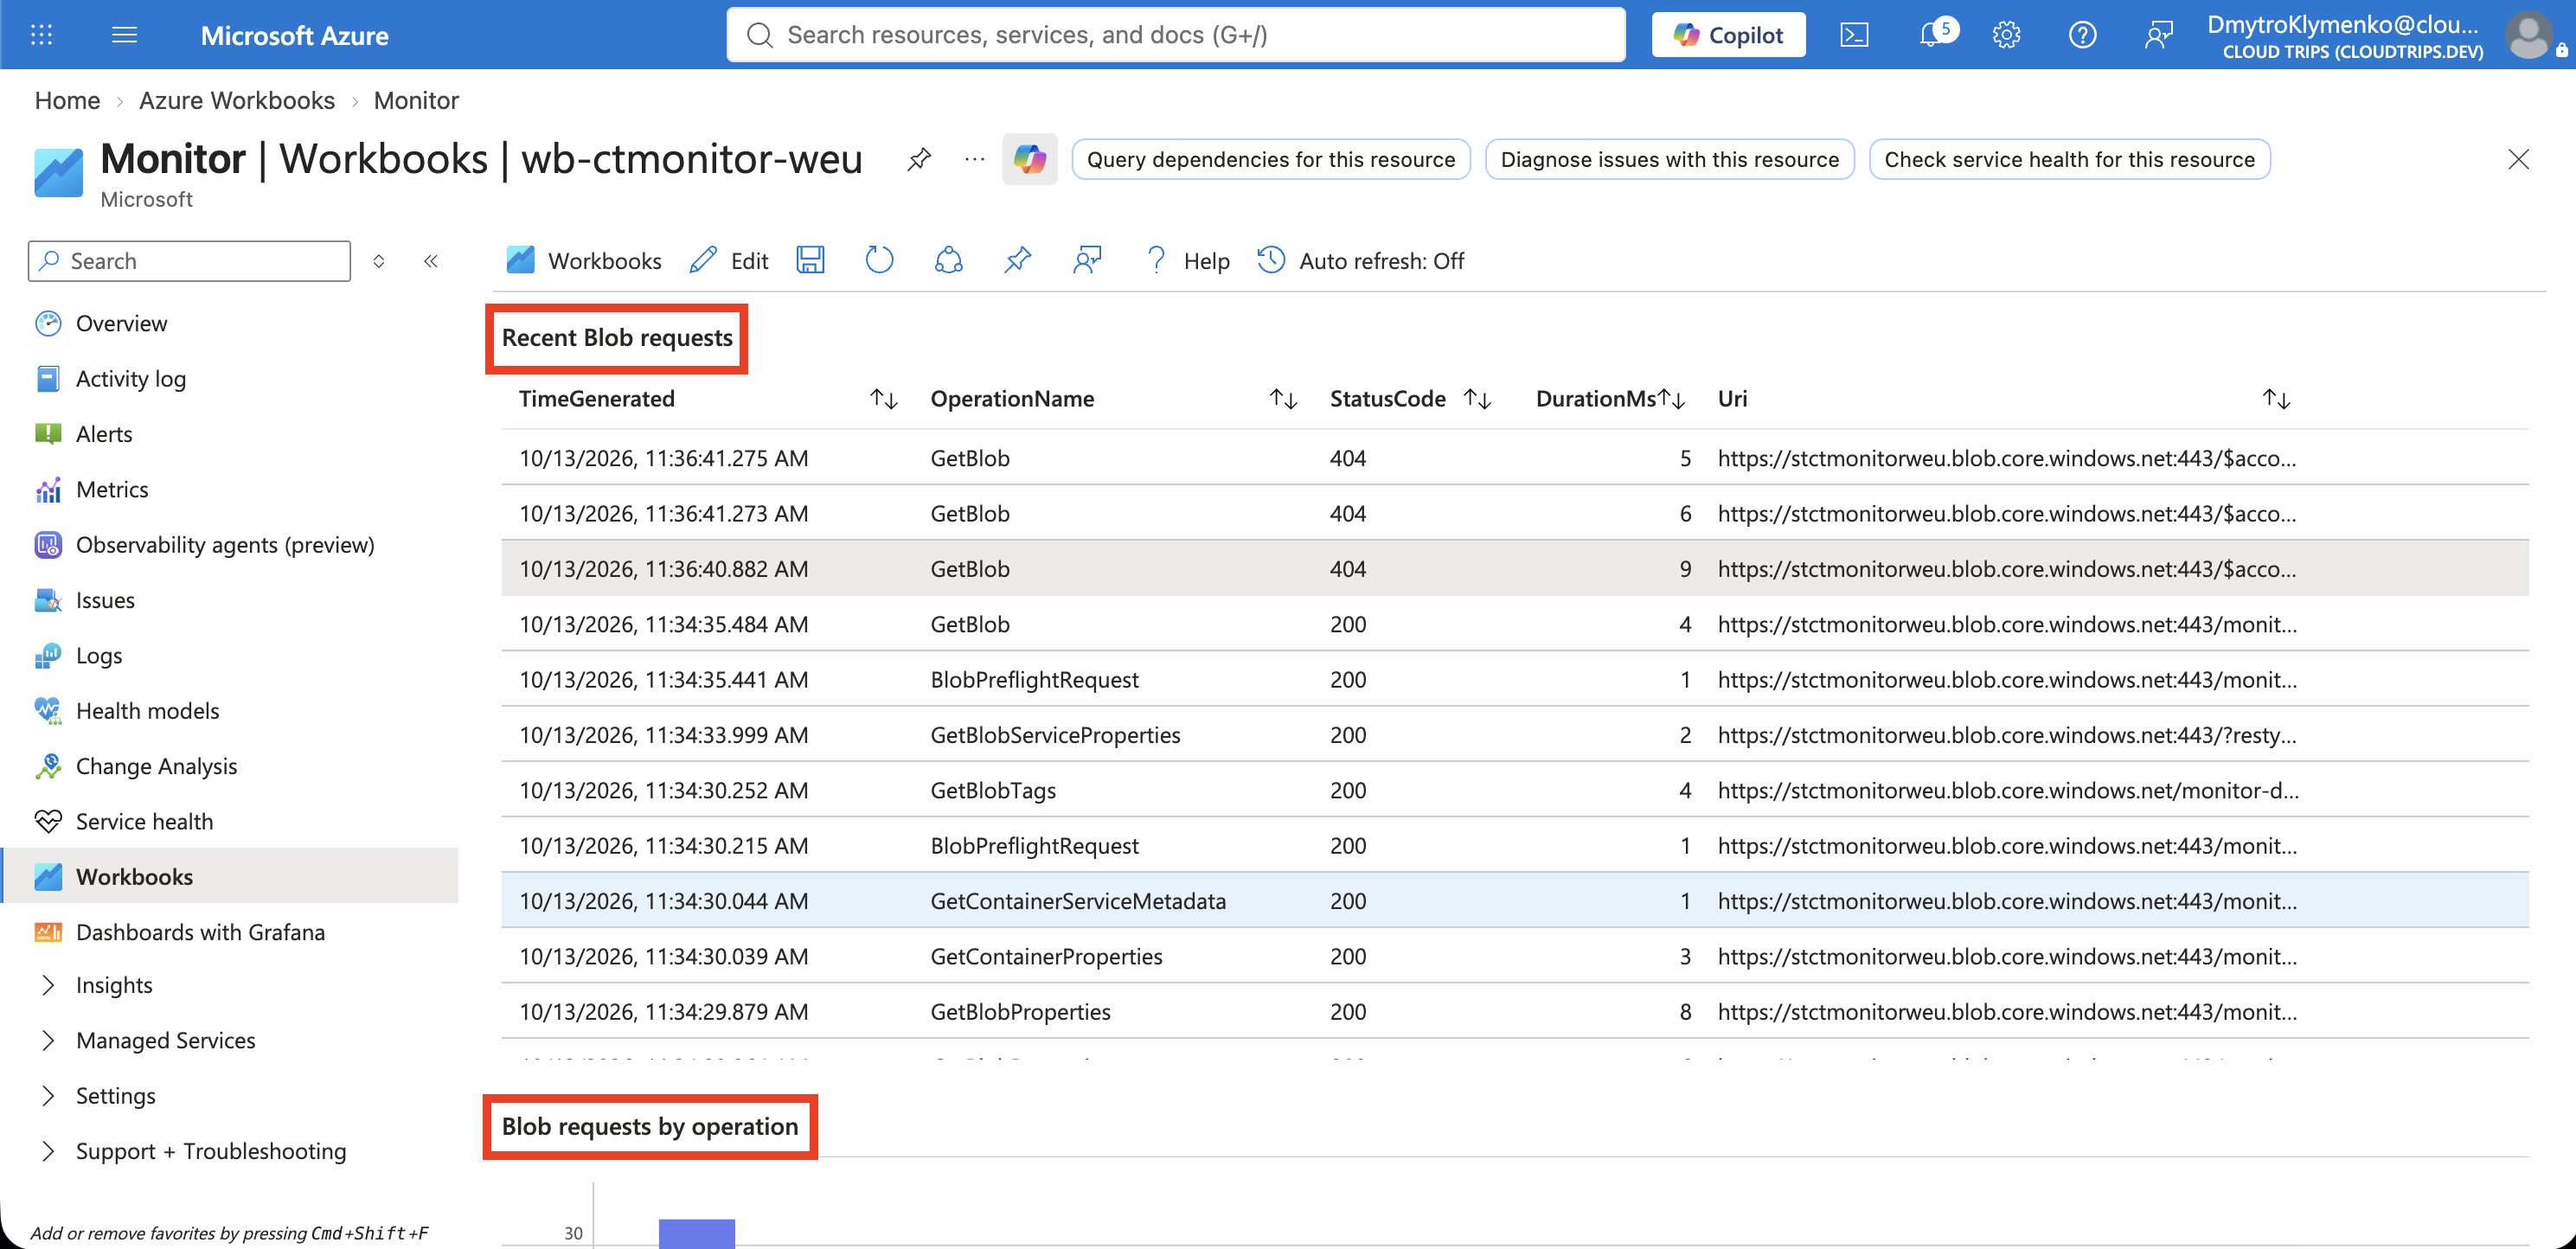
Choose Bar chart and title it Blob requests by operation. Each bar counts recorded requests for one operation. Add a short text item above the queries naming the account and the 24-hour window.
Save the workbook:
Title: wb-ctmonitor-weu
Subscription: CloudTrips TEST
Resource group: rg-cloudtrips-monitor-test-weu
Location: West Europe
Screenshot 1: Saved workbook displaying the recent-request grid and requests-by-operation chart.
Pin Results to a Dashboard
Open the Azure portal menu → Dashboard → Create → Custom dashboard. Name it dash-ctmonitor-weu, save it, and choose Share → Publish to create a shared dashboard in rg-cloudtrips-monitor-test-weu. Publishing makes it an Azure resource governed by access permissions.
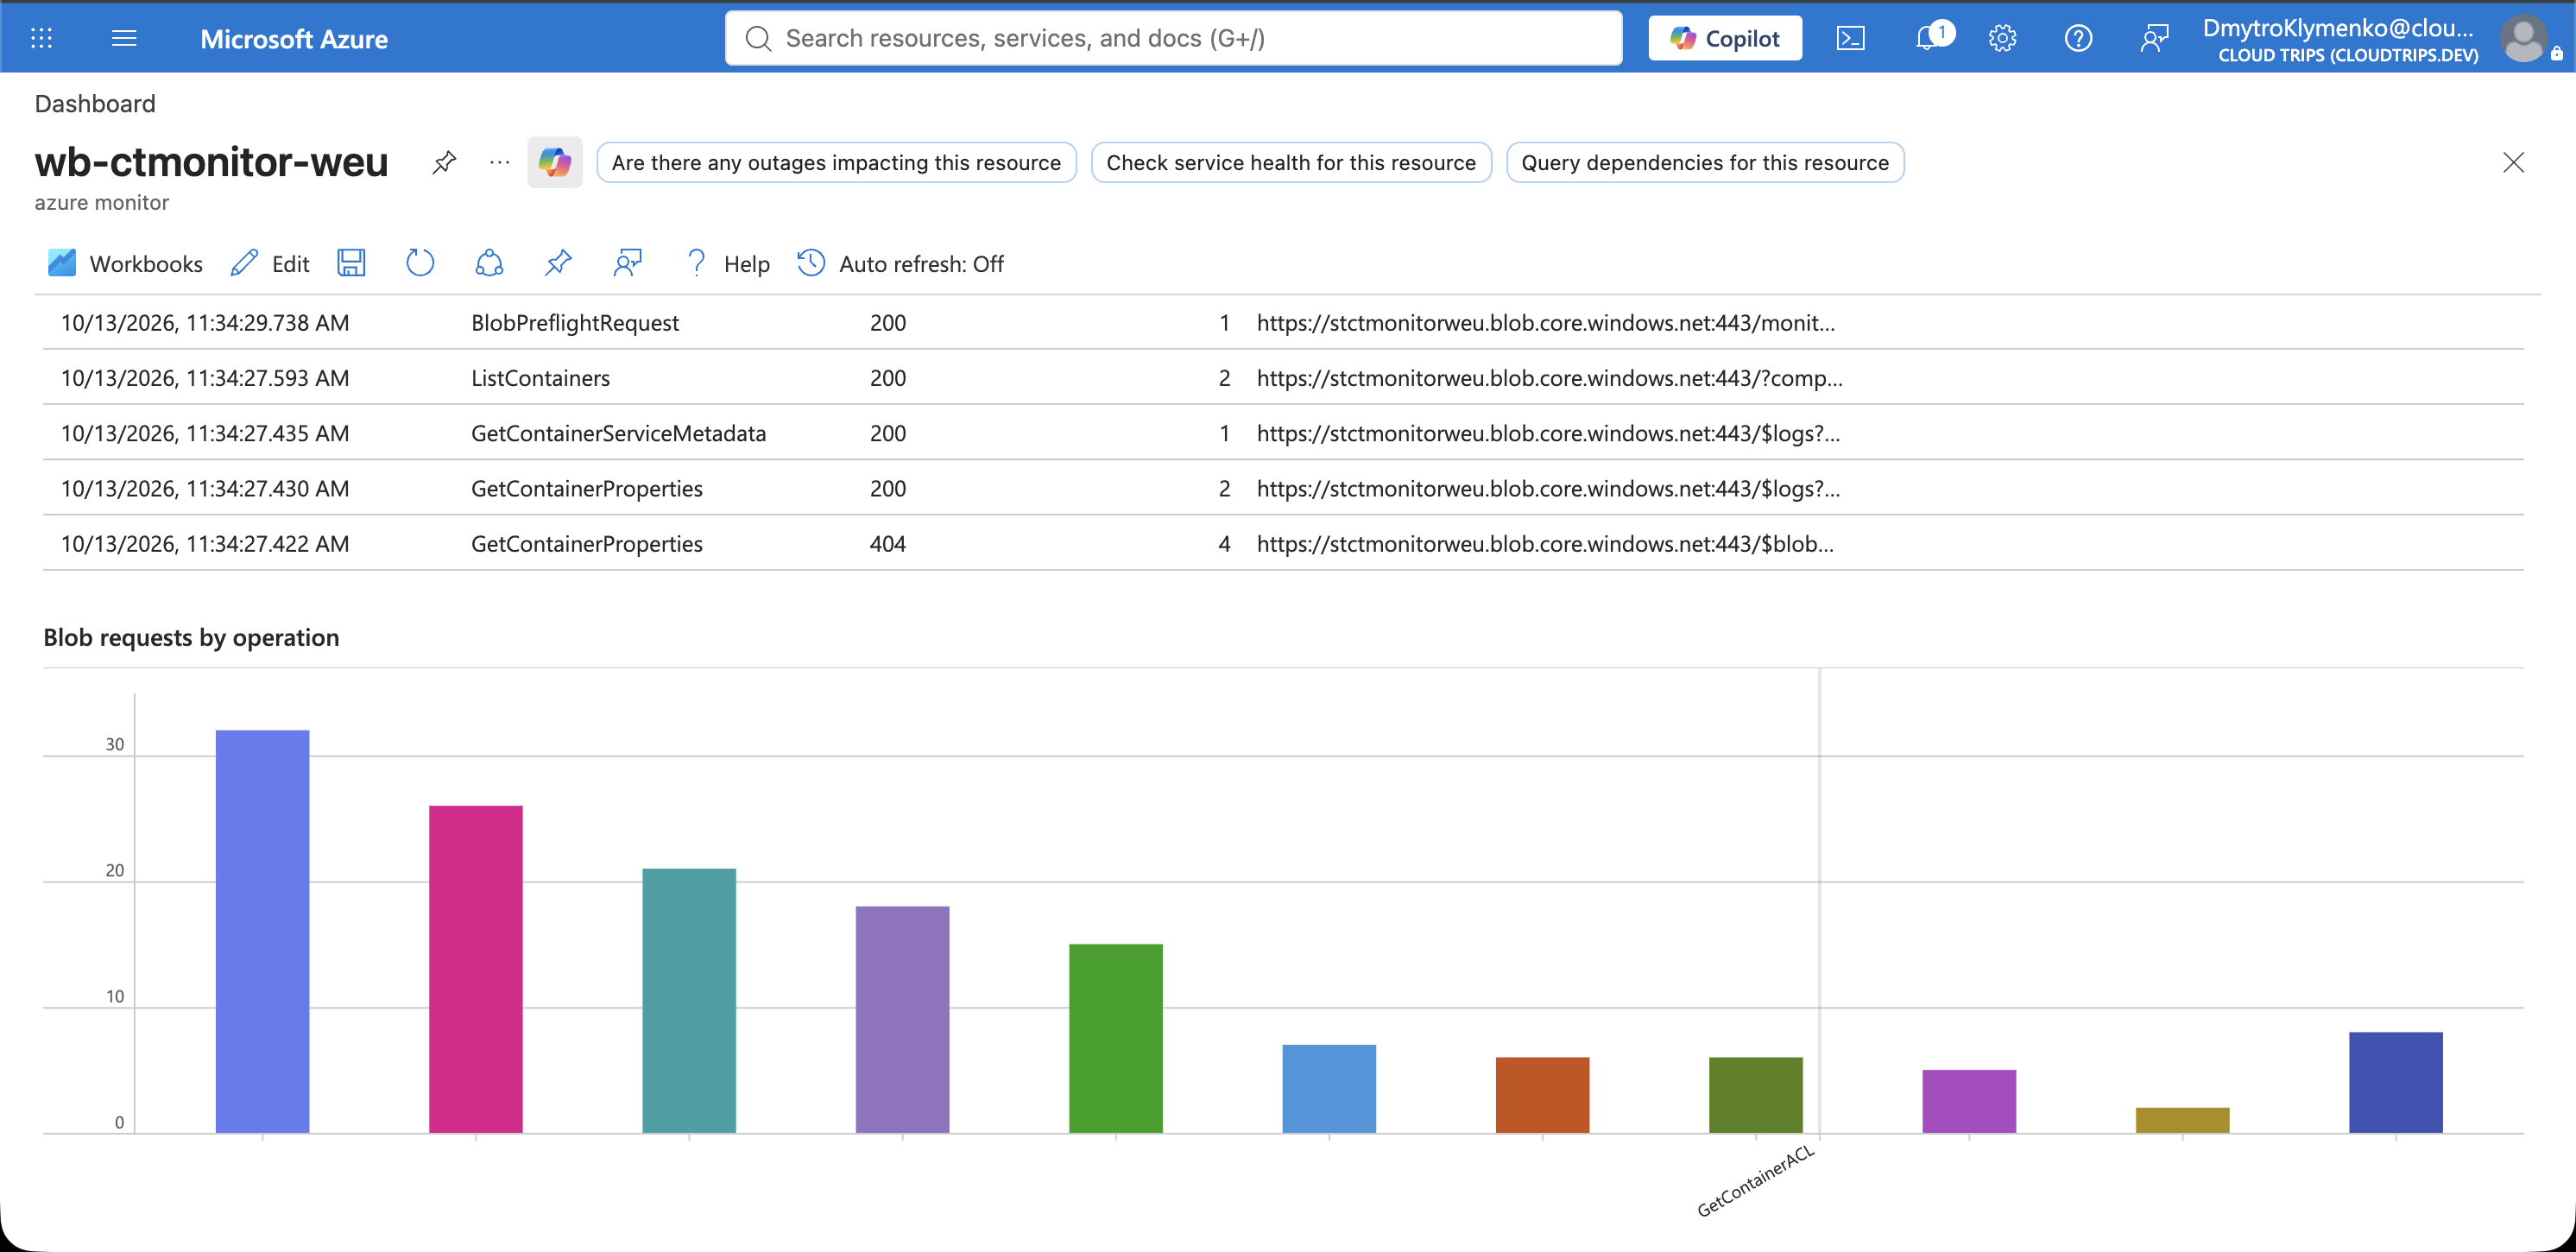
Return to the saved workbook. Select Edit, then Pin on the top toolbar to enter pin mode. Use the pin on the bar-chart item, select the shared dashboard, and confirm. Pin the grid too if you want both views. Open Dashboard → dash-ctmonitor-weu, arrange the tiles, and save.
Screenshot 2: Azure dashboard with the pinned workbook results and their titles visible.
Verify and Interpret
Open the dashboard again and refresh the tile. Compare it with the workbook for the same period. This lab uses a fixed Last 24 hours item setting and a matching KQL filter. A dashboard time-picker change only controls workbook parts configured with a time-range parameter; use the workbook to change this lab’s window and repin the edited part.
Pinning stores the item’s configuration at that moment. Later workbook edits require removing and repinning that tile. Share access by assigning the intended users permission to the dashboard, workbook, and underlying workspace data; dashboard visibility alone does not grant log access.
Finish
Keep both views for later monitoring Trips. Delete dash-ctmonitor-weu and wb-ctmonitor-weu if you only want to remove the reports. Keep law-ctmonitorweu while other labs use its data.