App Performance Needs Monitoring? Enable Application Insights
You can see that a website responds, but you also need to know how long requests take and whether they fail. Application Insights collects application telemetry. A request record describes one incoming operation; dependencies describe calls the application makes to other services.
Reuse your running Node.js App Service from Create App Service, law-ctmonitorweu from Configure Log Analytics, and ag-ctmonitor-email from Create a Metric Alert. Recreate the app first if you deleted it. Telemetry ingestion can incur charges.
Connect the Application
In the Azure portal, create an Application Insights resource:
Subscription: CloudTrips TEST
Resource group: rg-cloudtrips-monitor-test-weu
Name: ai-ctmonitorweu
Region: West Europe
Log Analytics workspace: law-ctmonitorweu
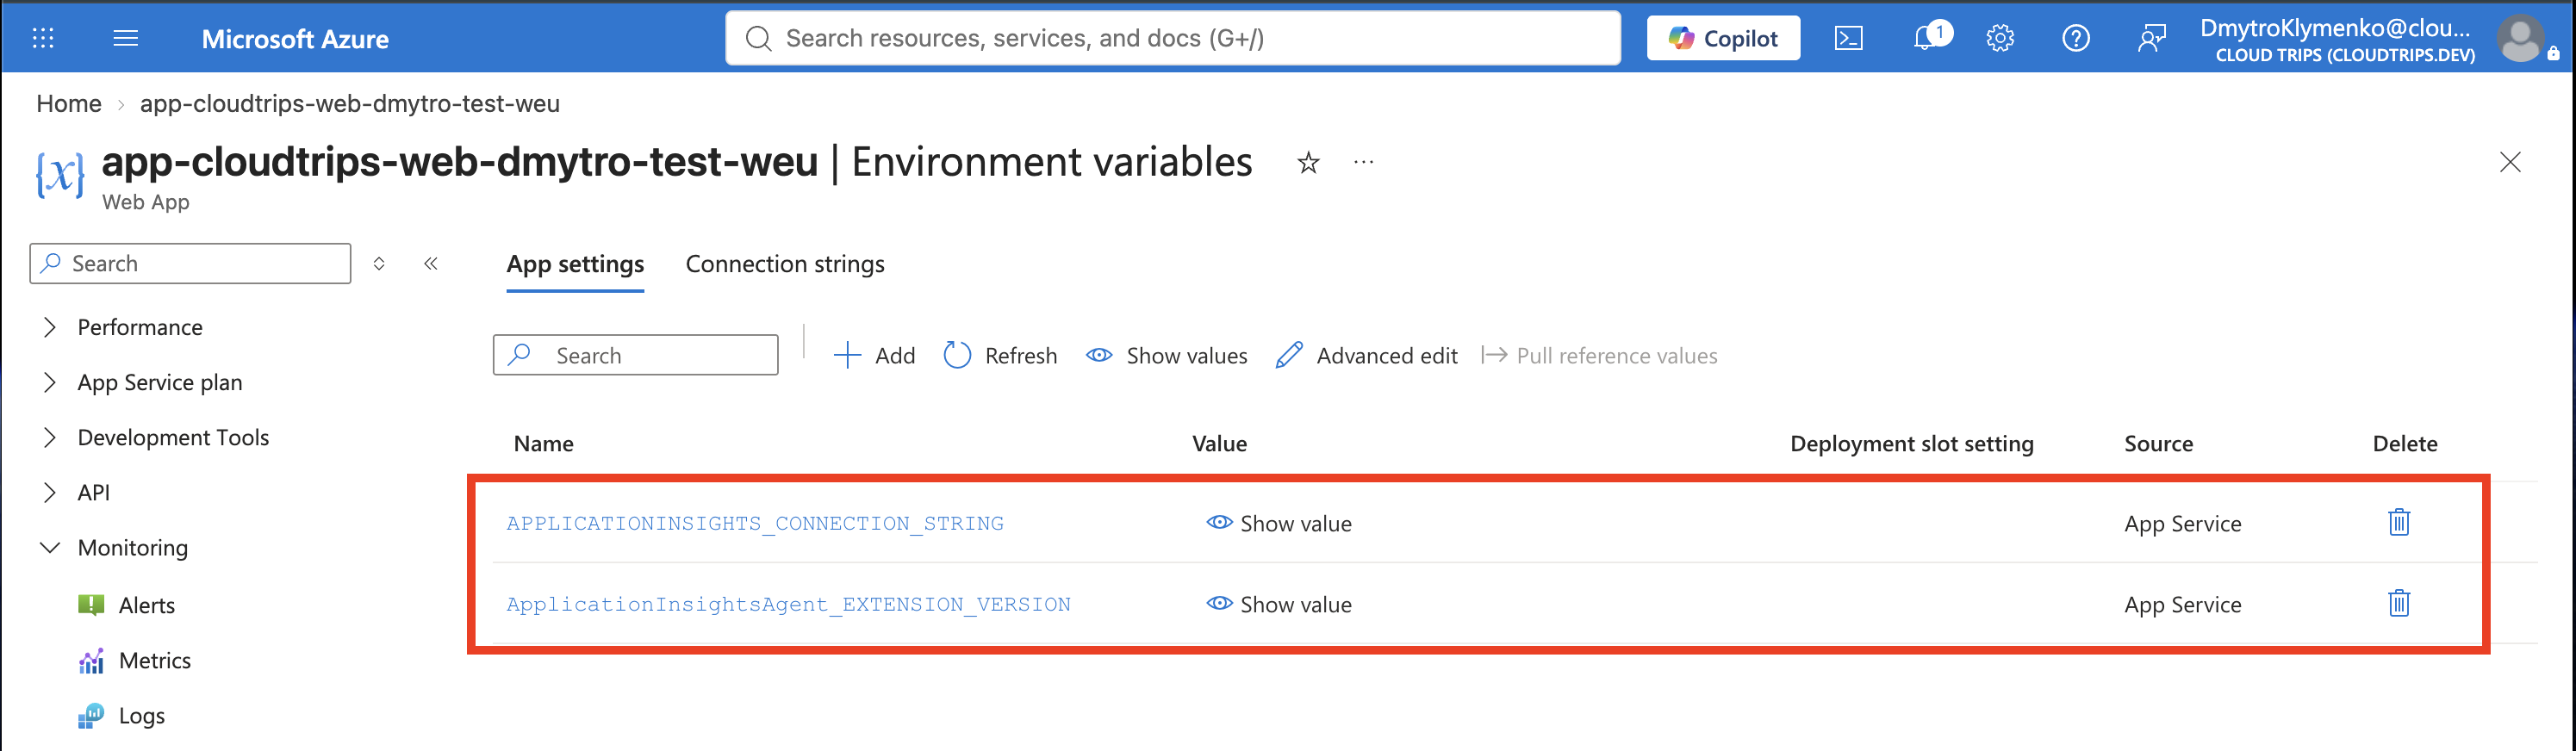
Copy the Connection string from ai-ctmonitorweu → Overview. Open your App Service → Settings → Environment variables → App settings. Add or update these two settings:
APPLICATIONINSIGHTS_CONNECTION_STRING = connection string from ai-ctmonitorweu → Overview
ApplicationInsightsAgent_EXTENSION_VERSION = ~3
Select Apply/Save, confirm the changes, and restart the app from Overview → Restart. These settings enable the App Service-managed instrumentation agent for the Linux Node.js app used in the earlier Trip. This integration is in public preview. An app already instrumented through its own SDK should use that existing configuration.
The Application Insights menu inside App Service may remain greyed out. Open the monitoring resource directly through the Azure portal search: Application Insights → ai-ctmonitorweu. Incoming request telemetry in the next step confirms that monitoring is working.
Screenshot 1: App Service Environment variables showing both saved setting names, with their values concealed.
Follow a Request
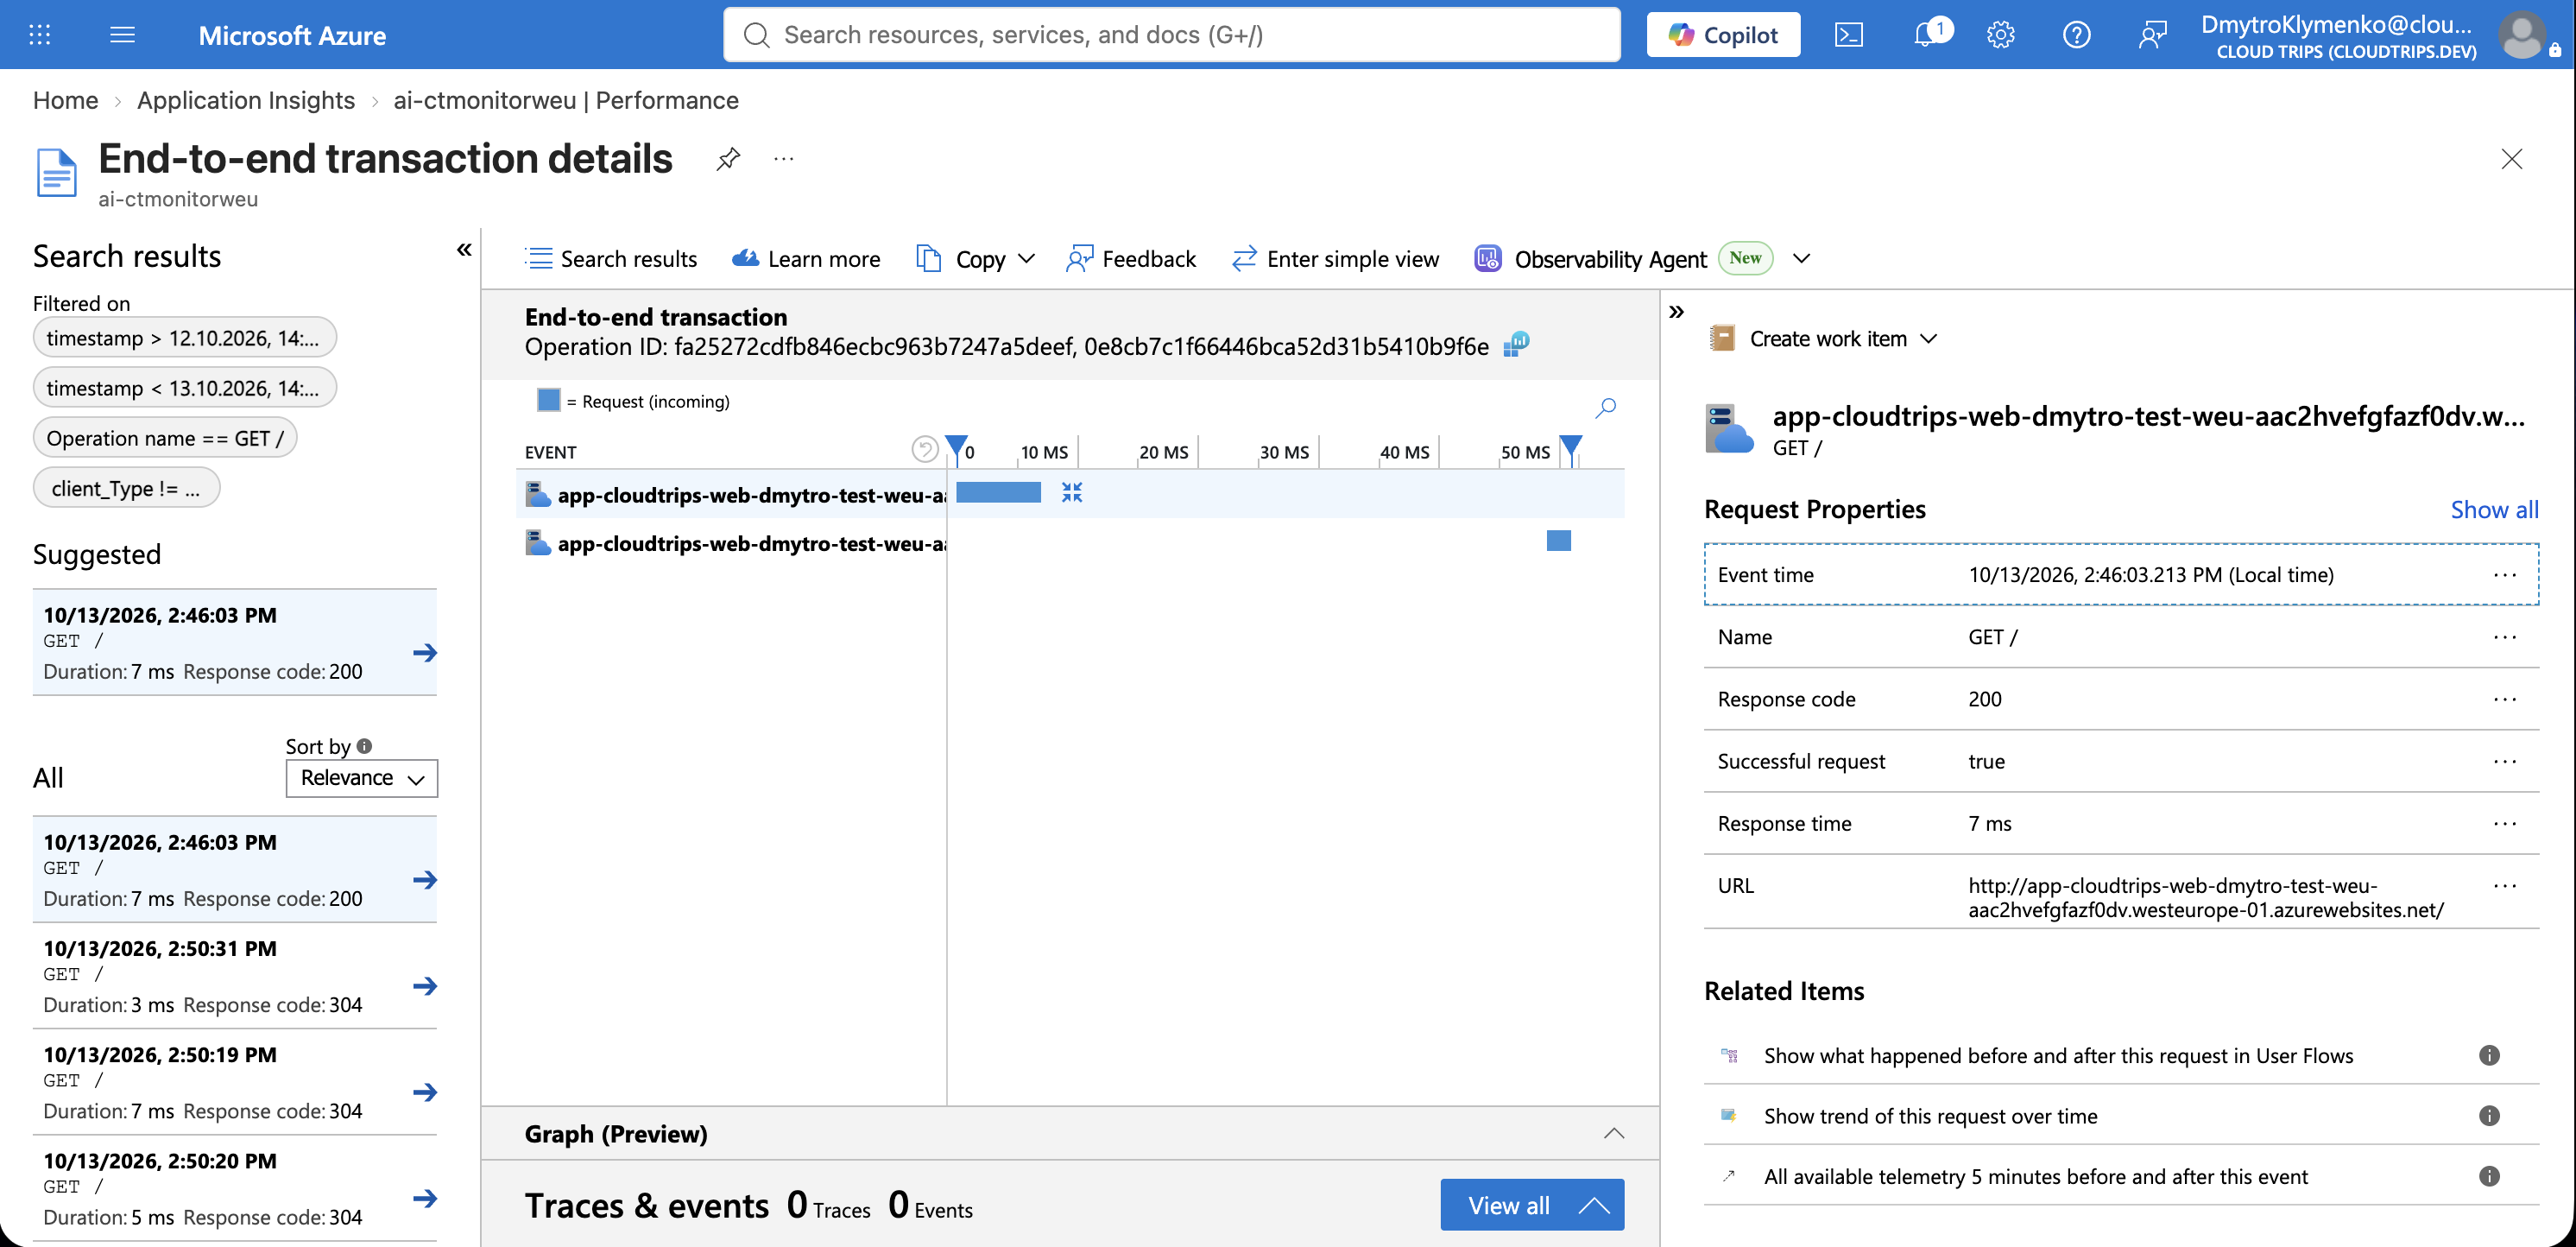
Open the app’s Default domain from its Overview page. Refresh it about ten times, a few seconds apart. Open ai-ctmonitorweu → Performance and select Last 30 minutes. Allow several minutes for telemetry to arrive, then select a request operation and drill into a sample’s End-to-end transaction details.
Inspect the request URL, timestamp, result code, duration, and operation ID. The simple app from the earlier Trip returns HTTP 200 for every path. Its request list may therefore contain several successful paths without any failures.
Screenshot 2: A request’s end-to-end details showing its duration and successful result.
You can also inspect the records in law-ctmonitorweu → Logs → KQL mode:
AppRequests
| where TimeGenerated > ago(1h)
| where tolower(_ResourceId) endswith "/components/ai-ctmonitorweu"
| project TimeGenerated, Name, ResultCode, Success, DurationMs, OperationId
| order by TimeGenerated desc
AppRequests is the workspace table. Set the query time picker to at least Last hour. An empty result means you should check the app’s connection, restart, recent traffic, and ingestion delay before proceeding.
Review Smart Detection
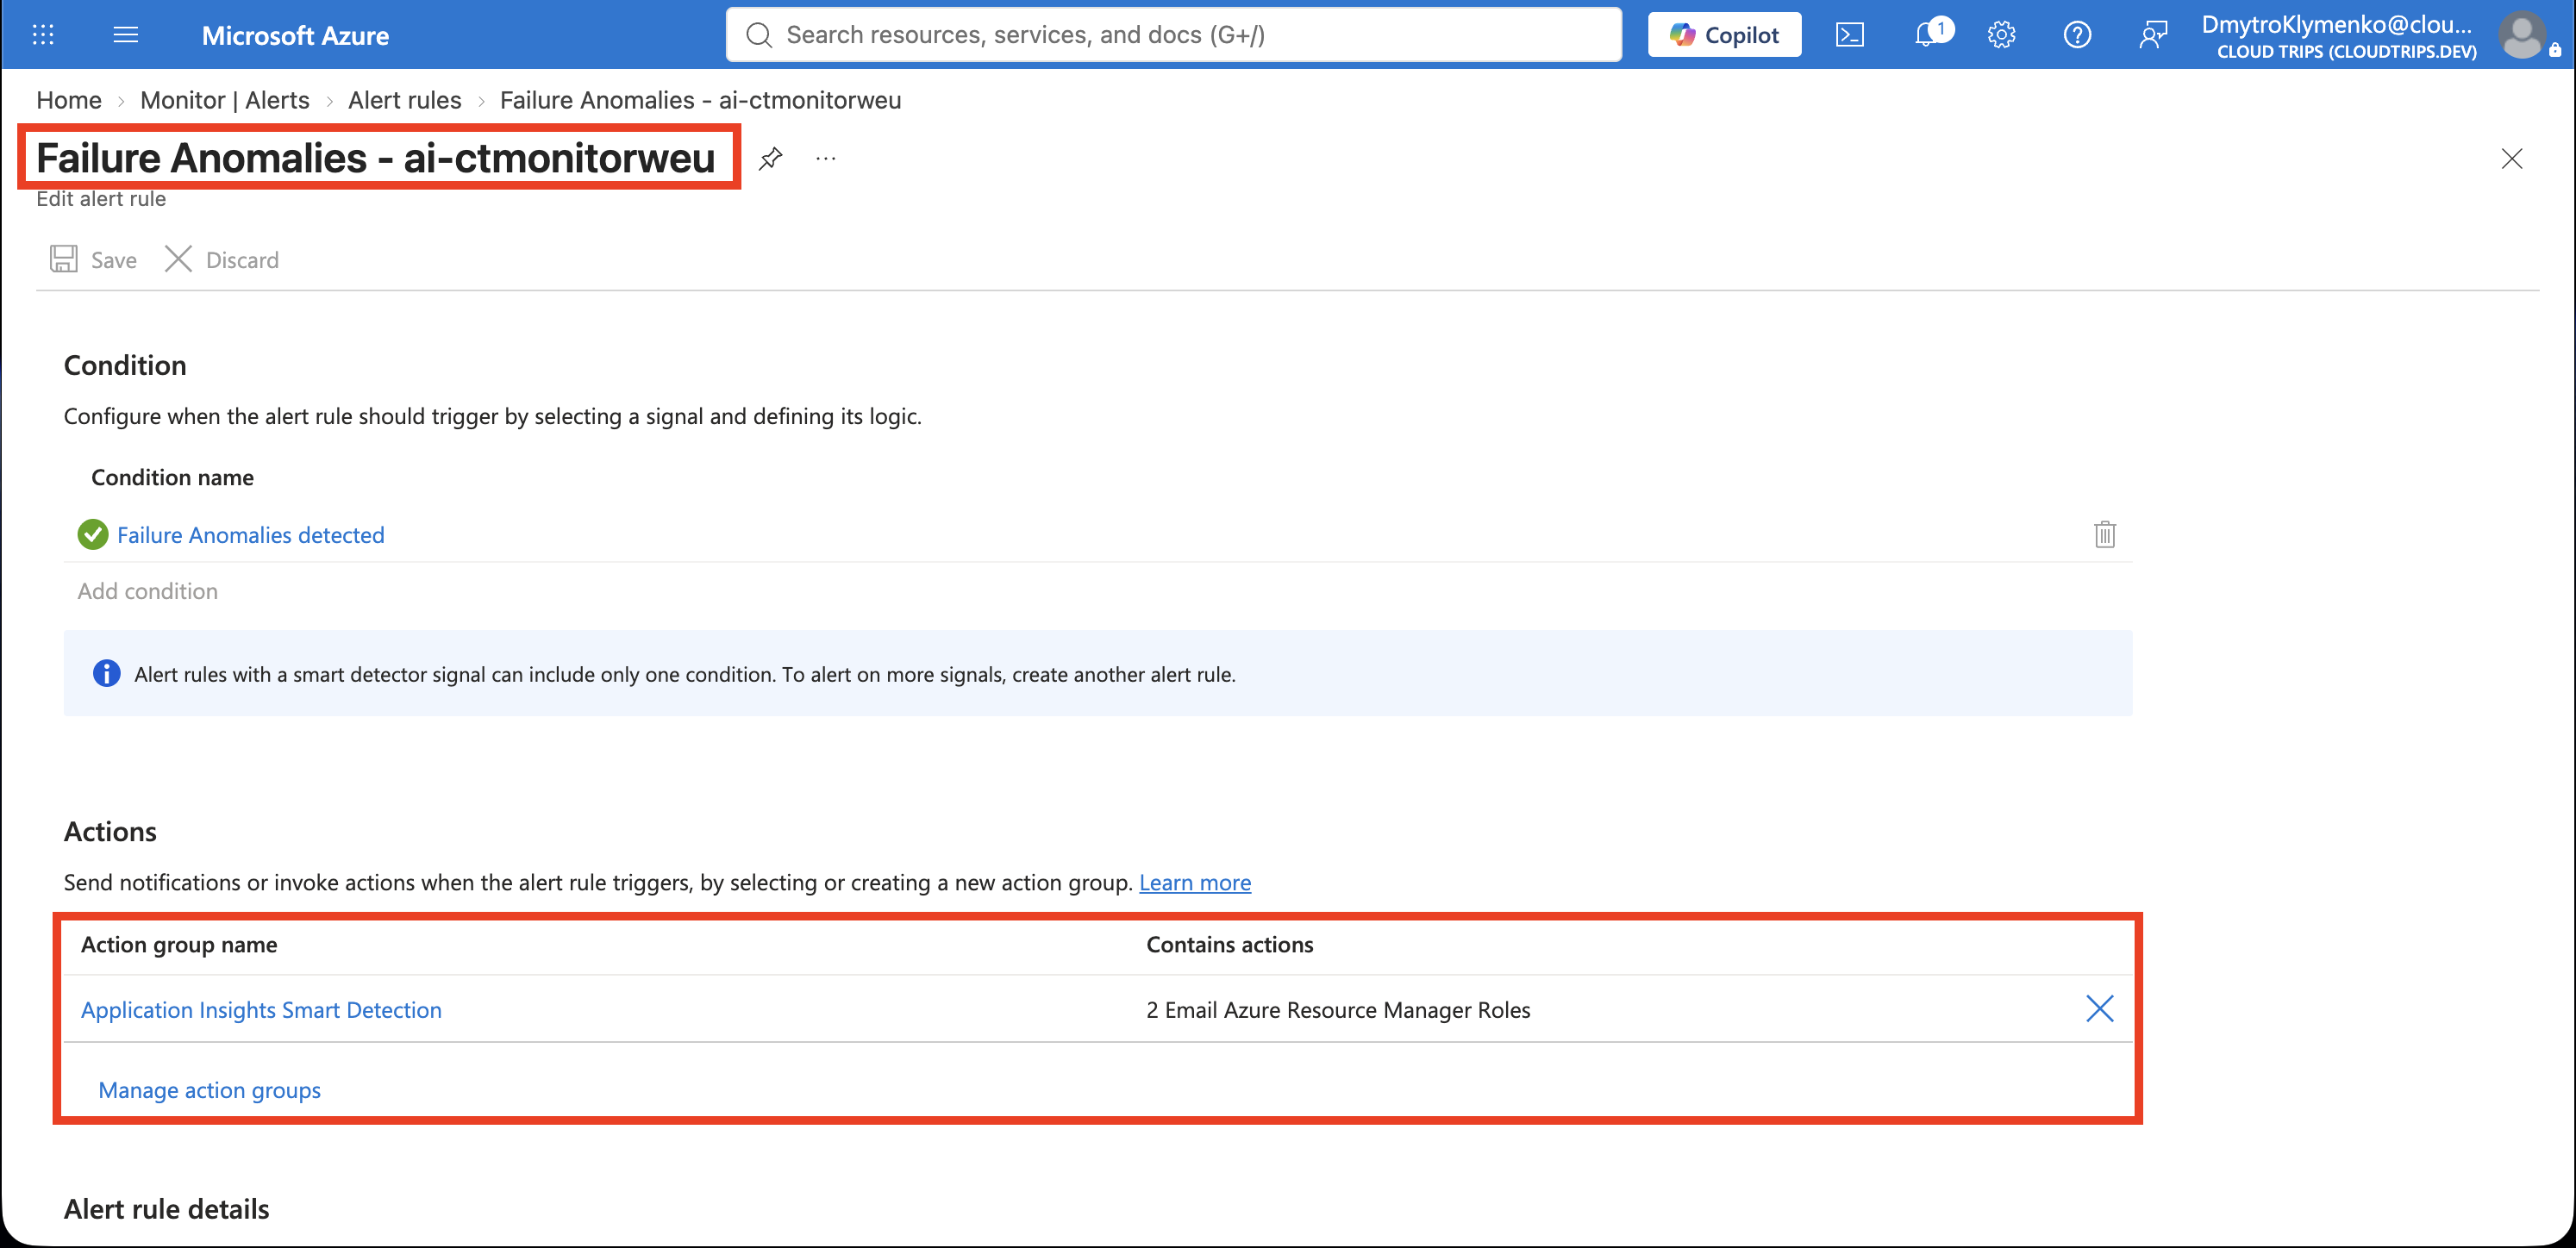
Open Azure Monitor → Alerts → Alert rules, filter to ai-ctmonitorweu, and look for its Failure Anomalies Smart Detection rule. Open it, check that it is enabled, and edit its action groups to include ag-ctmonitor-email. If the automatic rule is absent, check ai-ctmonitorweu → Smart Detection for failure-anomaly detection and its alert-rule settings.
Smart Detection learns normal failure patterns and looks for an unusual increase. It needs about 24 hours to learn and sufficient request volume. A small successful lab app may produce no anomaly alert. The completed step is an enabled rule with a notification destination; observe any future findings under Alerts and inspect their affected operations.
Screenshot 3: Failure Anomalies rule showing ai-ctmonitorweu and the configured action group.
Finish
Keep the app and Application Insights for the availability Trip. If you finish here, disable app monitoring and any alert rules you created before removing resources you no longer need. Deleting an Application Insights resource also removes its availability tests, so retain it while those tests are in use.