Kubernetes Needs Monitoring? Enable Container Insights and Managed Prometheus
Kubernetes monitoring needs both measurements and context. Managed Prometheus collects time-series metrics such as pod state and resource usage. Container Insights provides cluster views and collects container logs and events. A container’s output helps explain what happened around a metric change.
Reuse law-ctmonitorweu from Configure Log Analytics. This lab creates an AKS cluster to reuse in the next Grafana Trip. Review the creation estimate: a Free control-plane tier still has paid worker VMs, disks, networking, and monitoring usage. You need permission to create resources and assign roles.
Create the Cluster and Choose the Destinations
In the Azure portal, create an Azure Monitor workspace named amw-ctmonitorweu, in rg-cloudtrips-monitor-test-weu, West Europe. This holds Prometheus metrics. The existing Log Analytics workspace law-ctmonitorweu holds logs. These are different resource types with different query languages: PromQL for Prometheus and KQL for logs.
Create a Kubernetes service → Kubernetes cluster:
Resource group: rg-cloudtrips-monitor-aks-test-weu
Cluster name: aks-ctmonitorweu
Region: West Europe
Cluster preset: Dev/Test
Pricing tier: Free
Kubernetes version: current supported default
System node pool: Linux, Standard_D4s_v5 or a supported available 4-vCPU size
Node count: 2, manual scaling
Authentication/authorization: Microsoft Entra ID with Azure RBAC
Cluster identity: System-assigned managed identity
API server: Public access
Network configuration: Azure CNI Overlay
Outbound type: Load balancer
Use the portal’s supported defaults for the remaining fields. Keep this lab cluster separate from production. On Monitoring, open Advanced settings if needed:
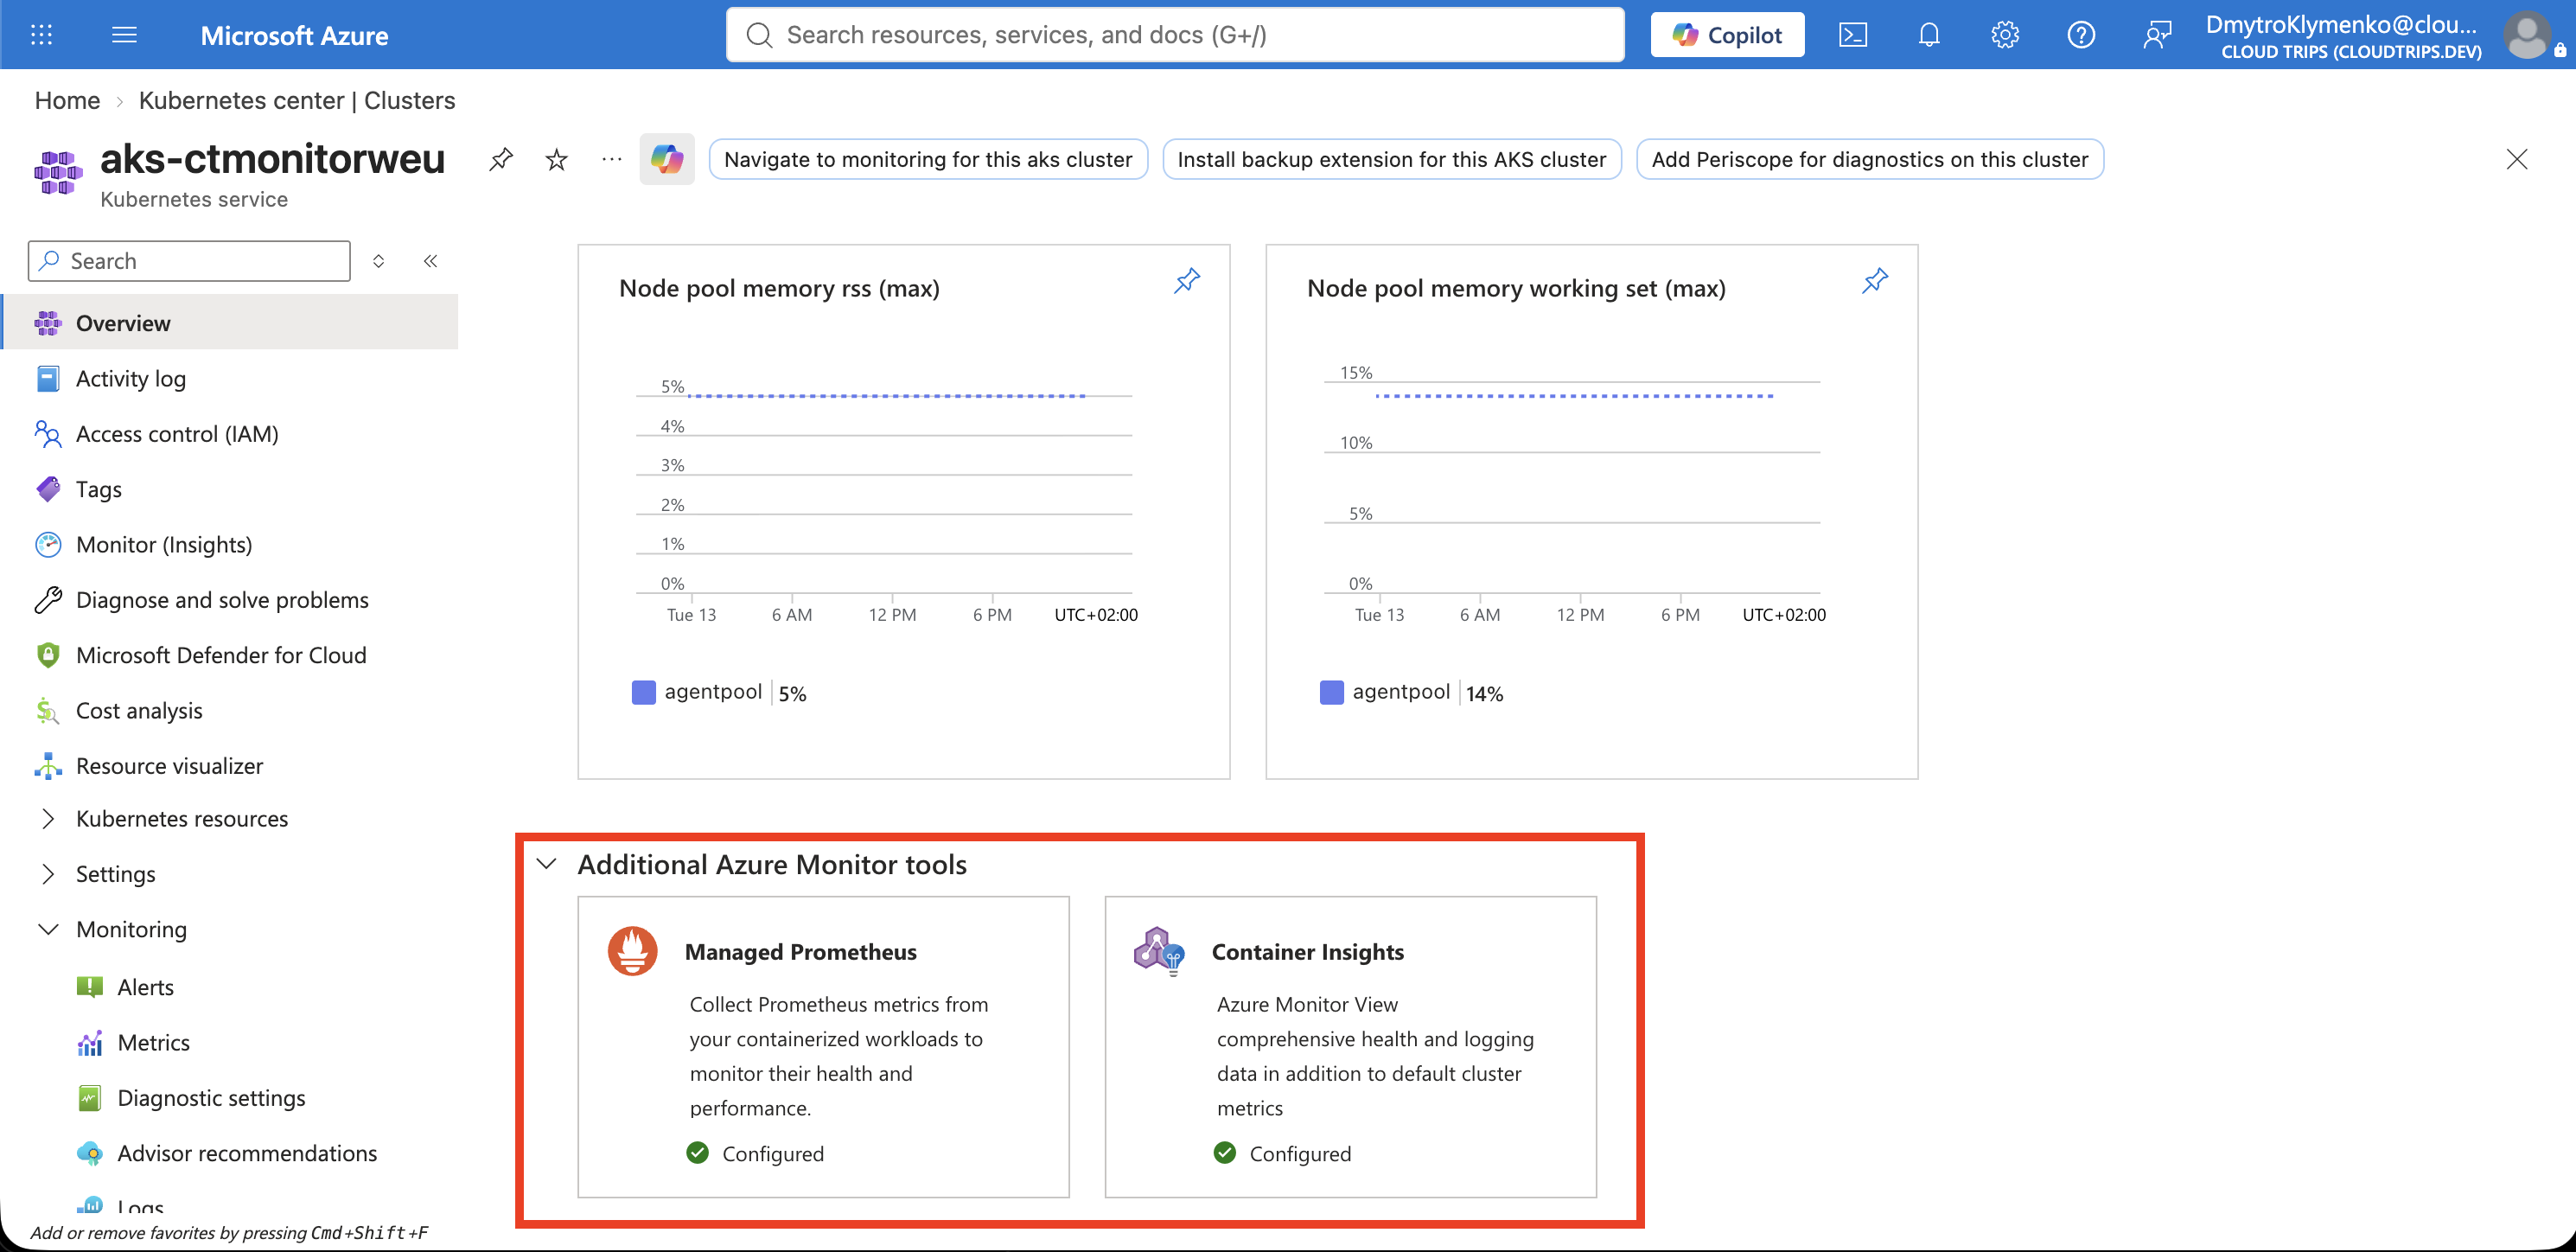
Prometheus metrics: Enabled
Azure Monitor workspace: amw-ctmonitorweu
Container logs and events / Container Insights: Enabled
Log Analytics workspace: law-ctmonitorweu
Logging profile: Standard
Grafana: leave unselected for now
For an existing cluster, find these choices under Monitor → Monitor Settings. Save and wait for provisioning to finish. Standard logging collects the lab container’s stdout; if you customize it, include monitor-demo, stdout, and the ContainerLogV2 table.
Screenshot 1: Cluster monitoring settings showing both enabled collectors and their respective workspaces.
Run a Small Workload
On aks-ctmonitorweu → Access control (IAM), assign your user Azure Kubernetes Service RBAC Cluster Admin for this dedicated lab cluster. Allow role propagation. Download monitor-demo.yaml.
Open Azure Cloud Shell → Bash and use its Upload control to upload the file. Cloud Shell provides the CLI and Kubernetes tools. Run:
az account set --subscription 'CloudTrips TEST'
az aks get-credentials --resource-group rg-cloudtrips-monitor-aks-test-weu --name aks-ctmonitorweu
kubelogin convert-kubeconfig -l azurecli
kubectl config current-context
kubectl apply -f monitor-demo.yaml
kubectl rollout status deployment/monitor-heartbeat -n monitor-demo --timeout=180s
kubectl logs deployment/monitor-heartbeat -n monitor-demo --tail=5
Check the context is aks-ctmonitorweu before applying the file. It creates one namespace and a small container that prints a timestamp every 30 seconds. If access is forbidden, check the cluster-scoped RBAC assignment and wait for it to propagate.
Check Logs and Metrics
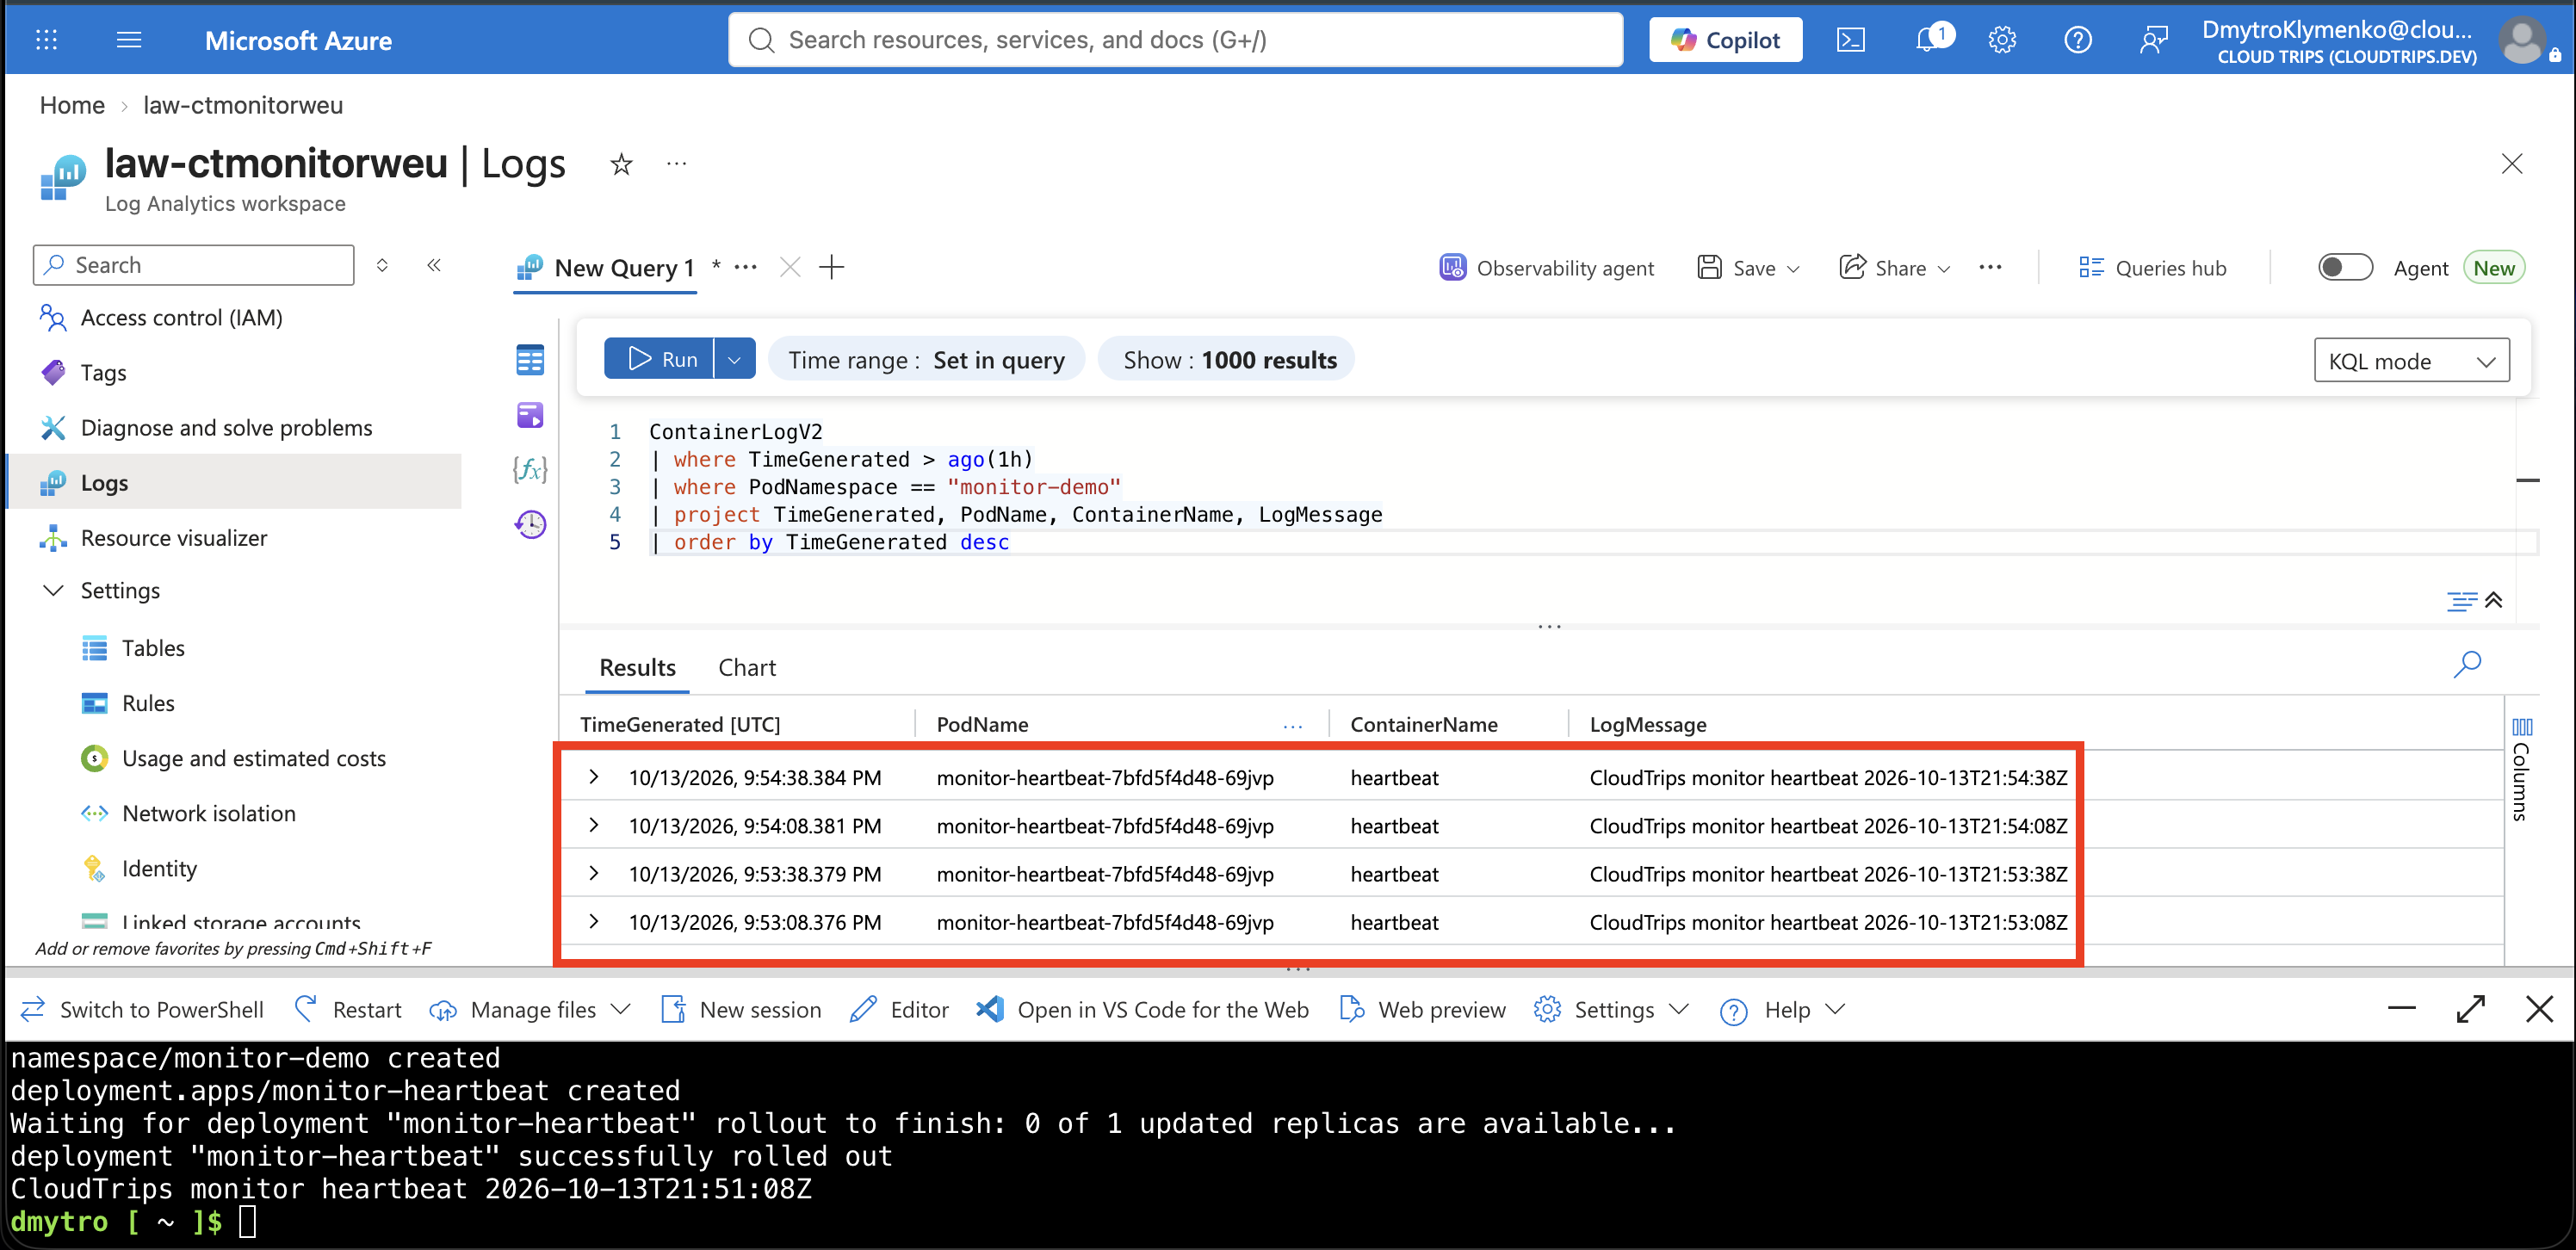
Open the cluster’s Monitor / Insights view and locate monitor-heartbeat in the workload or controller view. After a few minutes, open law-ctmonitorweu → Logs and run:
ContainerLogV2
| where TimeGenerated > ago(1h)
| where PodNamespace == "monitor-demo"
| project TimeGenerated, PodName, ContainerName, LogMessage
| order by TimeGenerated desc
Screenshot 2: ContainerLogV2 results showing the heartbeat messages and pod name.
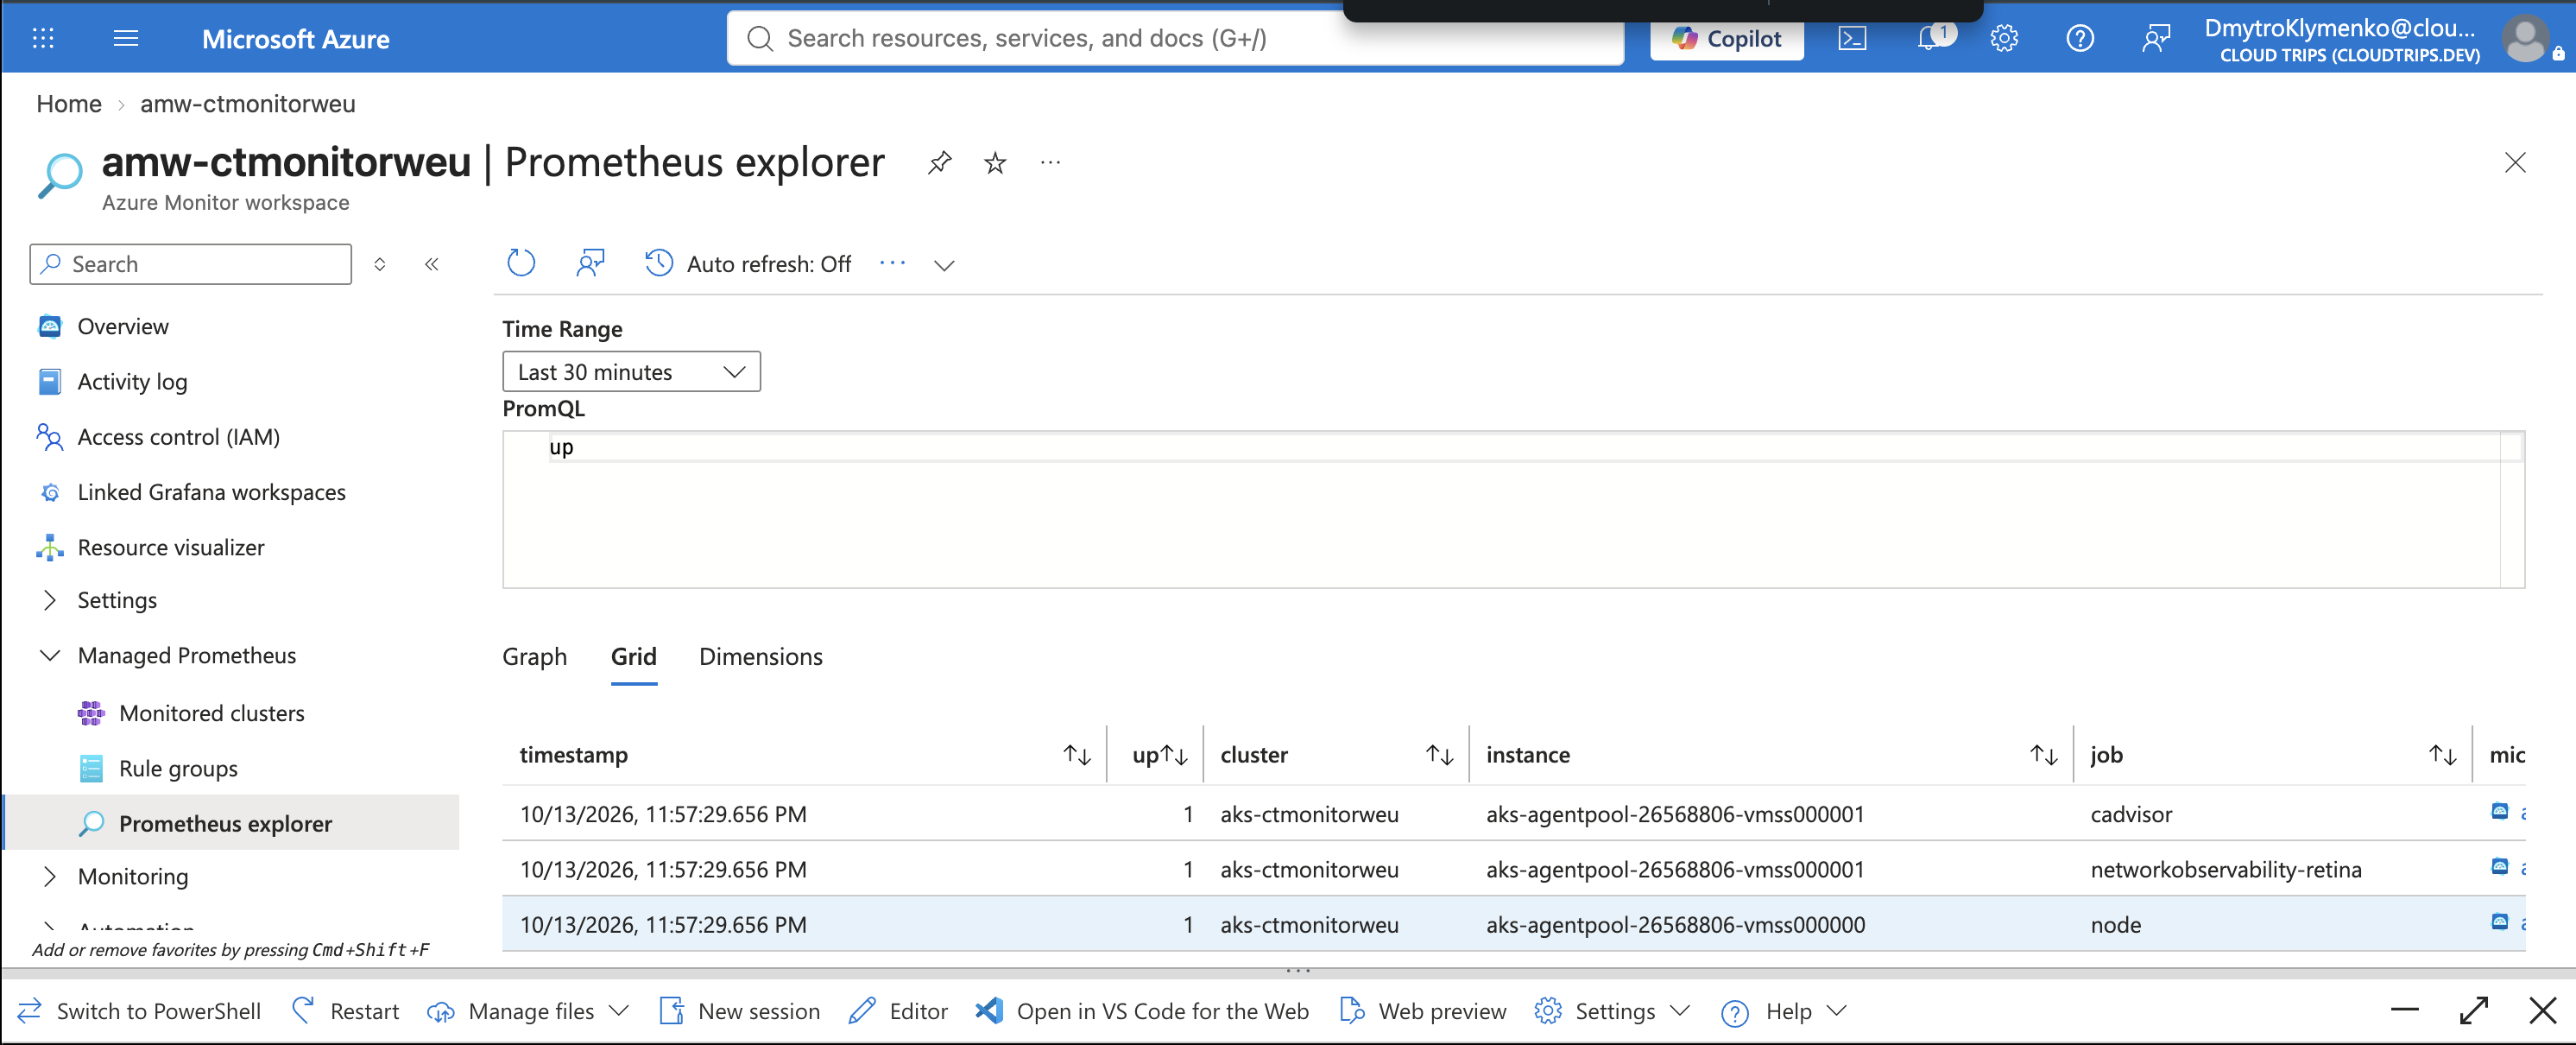
Open amw-ctmonitorweu → Prometheus explorer, or its Metrics page with the PromQL editor, and run:
upSelect Last 30 minutes. Each series represents a scrape target: 1 means its last scrape succeeded; 0 means it failed. This confirms metric collection from monitored targets. The heartbeat container emits logs and uses the cluster’s built-in Kubernetes metrics; it does not need its own Prometheus endpoint for this exercise.
Screenshot 3: Prometheus query returning scrape-target series for the cluster.
If a query is empty, first confirm the correct workspace. Then check the monitoring settings and allow ingestion time. For logs, also confirm the pod is running and stdout collection is enabled. Prometheus scrape success and application health are separate checks.
Finish
Keep the cluster running only if you are continuing directly to the Grafana Trip. Otherwise delete rg-cloudtrips-monitor-aks-test-weu; AKS also removes its managed node resources during cluster deletion. Keep the shared workspaces for other exercises. If you keep the cluster but remove the demo, run kubectl delete namespace monitor-demo.