Distributed Requests Need Investigation? Trace Them with OpenTelemetry
A slow checkout can originate in another service. Distributed tracing links the incoming request, the outgoing dependency call, and the receiving service’s request. They share a trace ID; each individual operation is a span with its own duration and parent relationship. OpenTelemetry carries this context between services through HTTP headers such as traceparent.
Reuse ai-ctmonitorweu from Enable Application Insights. For this lab, two small services run on your computer and export their telemetry to Azure. You need Node.js 22 or later and internet access. The prepared example includes the instrumentation; download and run it without writing application code.
Run the Prepared Example
Download the tracing demo ZIP and extract it. Open a terminal in its otel-trace-demo folder. Run:
node --version
npm ci
Copy the connection string from ai-ctmonitorweu → Overview. In the same terminal set it and start the example. For macOS, Linux, or Bash:
export APPLICATIONINSIGHTS_CONNECTION_STRING='PASTE_YOUR_CONNECTION_STRING'
npm start
For Windows PowerShell:
$env:APPLICATIONINSIGHTS_CONNECTION_STRING = 'PASTE_YOUR_CONNECTION_STRING'
npm start
Keep this terminal running. The launcher starts ct-front on 127.0.0.1:4000 and ct-back on 127.0.0.1:4001. Both use the same Application Insights destination and different OpenTelemetry service names. The SDK starts before the HTTP library loads, allowing it to collect and correlate HTTP operations automatically.
Visit http://127.0.0.1:4000/checkout in your browser. Repeat five times, with a few seconds between requests. You should see Inventory available. Then visit http://127.0.0.1:4000/checkout?fail=1 twice; this deliberately returns an inventory failure. The backend waits about 750 ms in both cases, making its contribution to total latency visible.
Follow the Shared Trace
After a few minutes, open ai-ctmonitorweu → Performance and select Last 30 minutes. Select the ct-front role and drill into a checkout sample’s end-to-end details. The transaction should contain the frontend request, its HTTP dependency call, and the backend request.
Screenshot 1: End-to-end transaction showing ct-front calling ct-back and the backend duration.
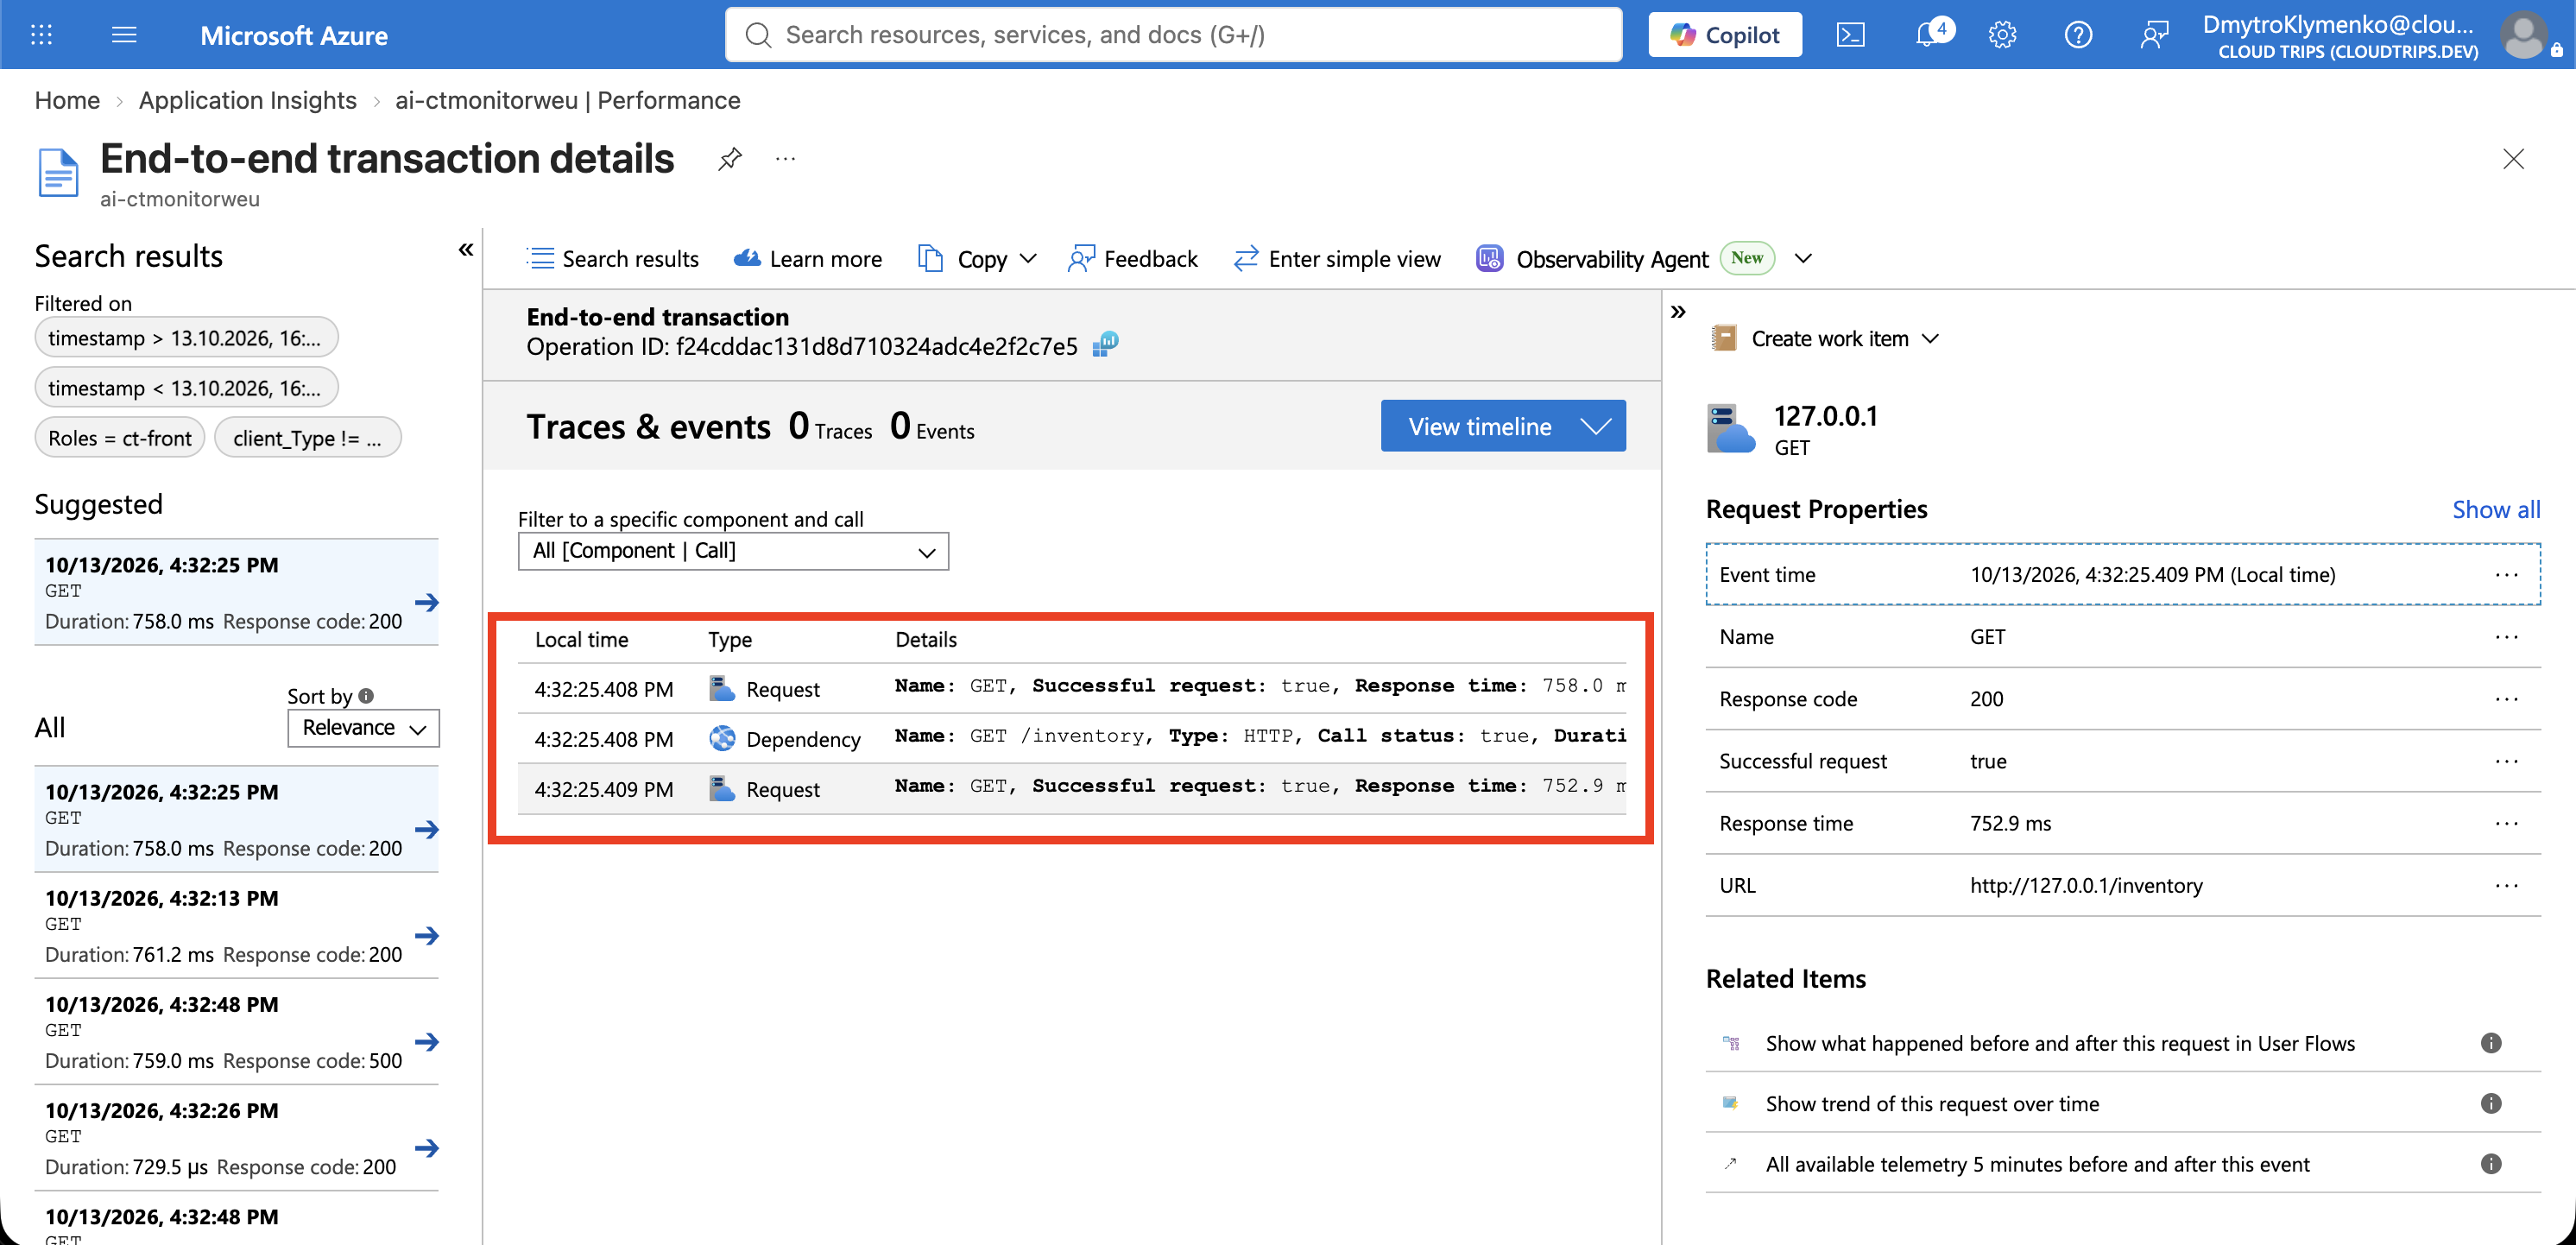
The frontend duration includes its wait for the backend. Adding the parent request duration to the nested dependency duration would count that waiting time twice.
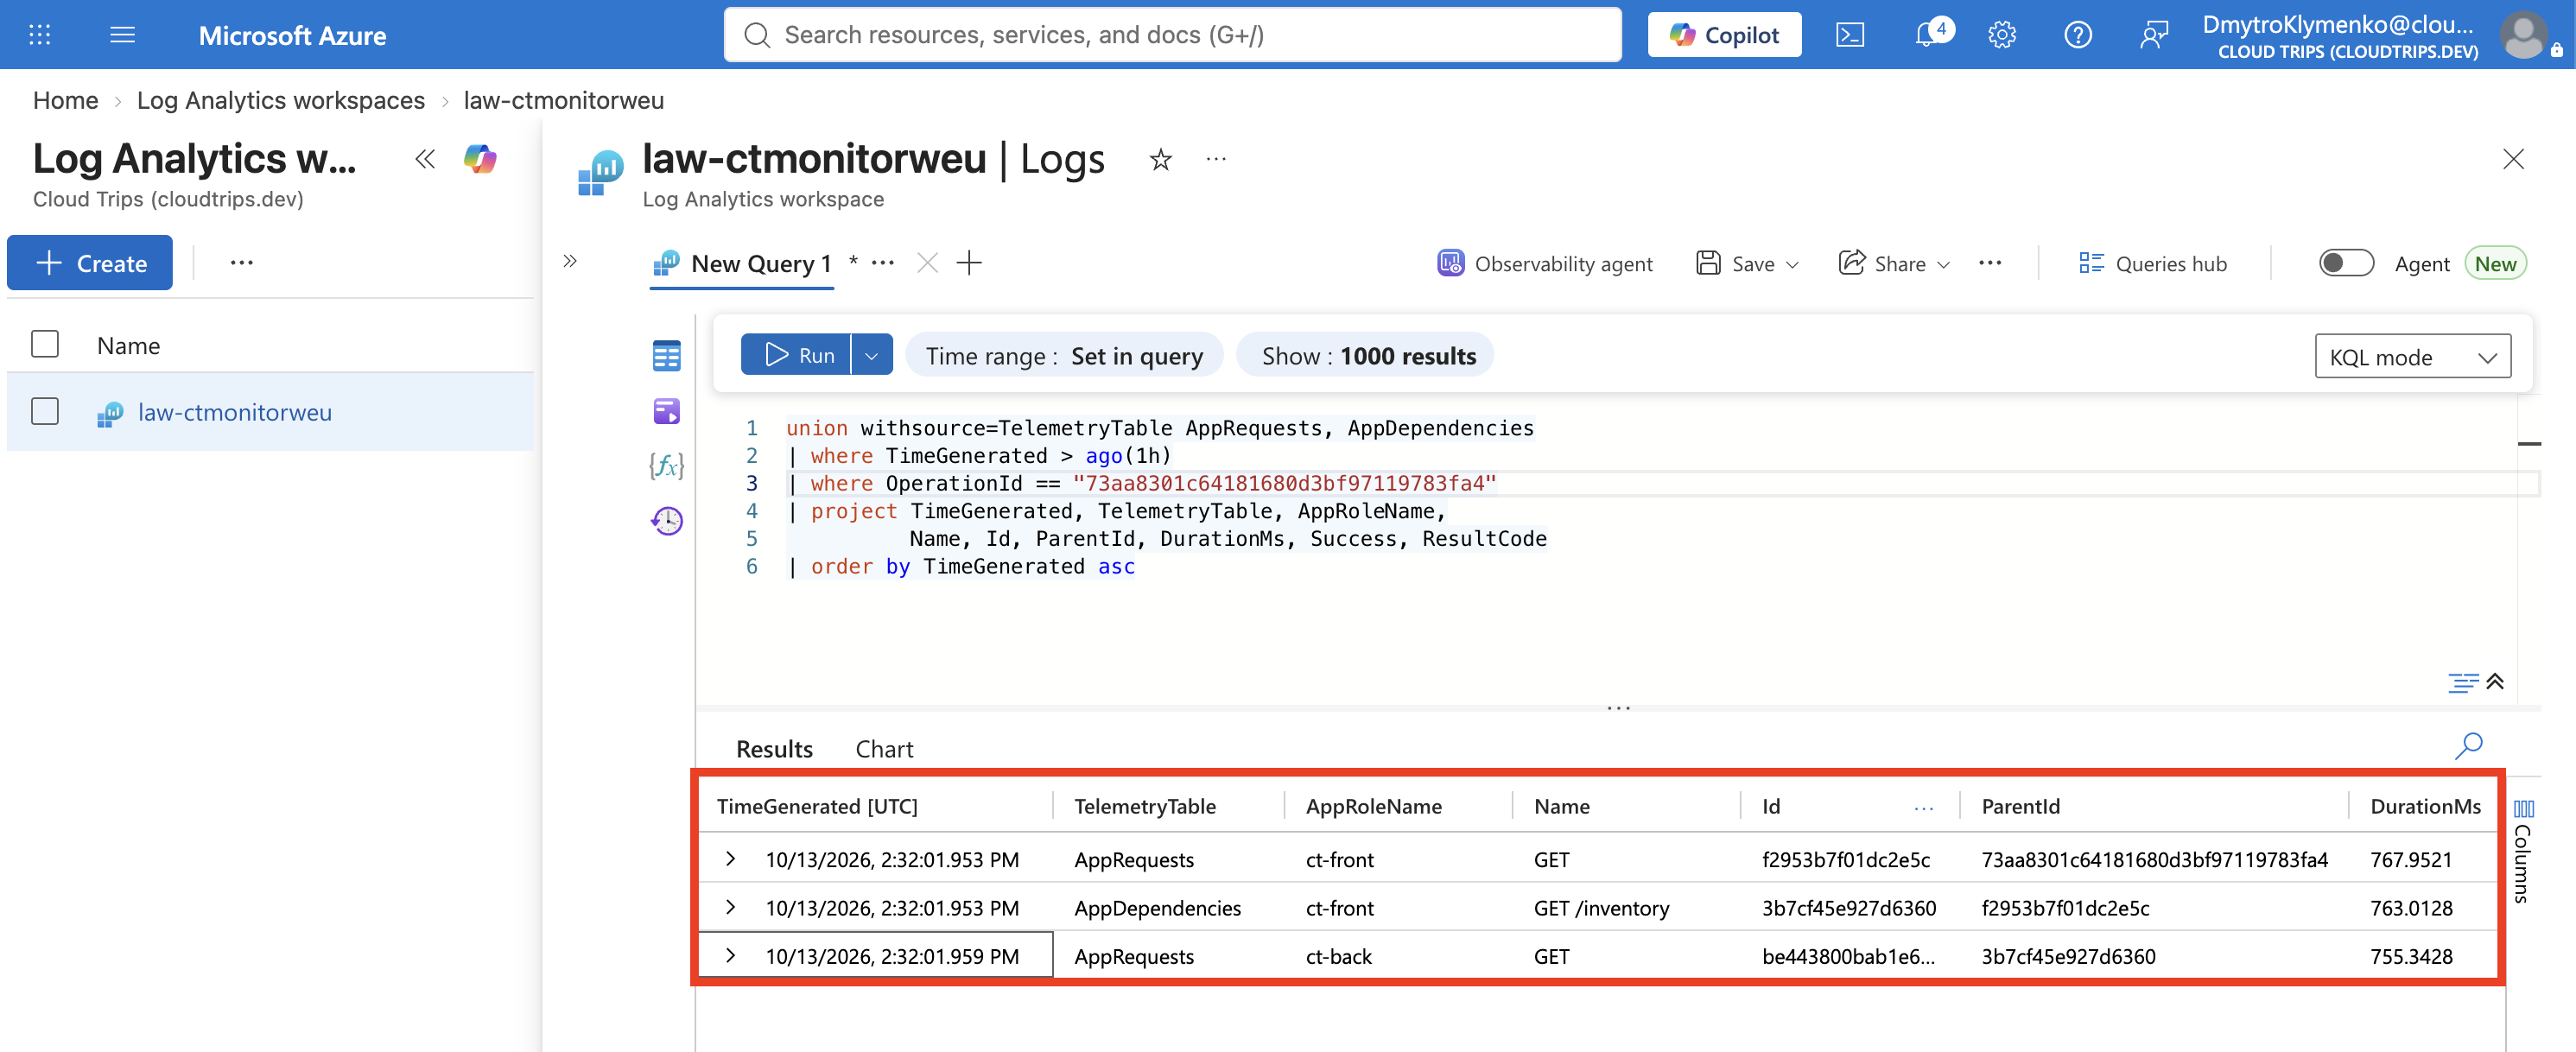
In law-ctmonitorweu → Logs, find a frontend operation ID:
AppRequests
| where TimeGenerated > ago(1h)
| where AppRoleName == "ct-front"
| project TimeGenerated, Name, Success, OperationId
| order by TimeGenerated desc
Copy one ID into this query:
union withsource=TelemetryTable AppRequests, AppDependencies
| where TimeGenerated > ago(1h)
| where OperationId == "PASTE_OPERATION_ID"
| project TimeGenerated, TelemetryTable, AppRoleName,
          Name, Id, ParentId, DurationMs, Success, ResultCode
| order by TimeGenerated asc
Screenshot 2: Correlated request and dependency rows sharing the selected OperationId.
Inspect the Application Map
Open ai-ctmonitorweu → Application Map, use the same time range, and refresh. Look for ct-front → ct-back. Select the edge or backend to inspect call counts, durations, and failed calls. Use Failures to open a failed checkout example and follow its backend HTTP 500.
Screenshot 3: Application Map showing both service roles and their dependency.
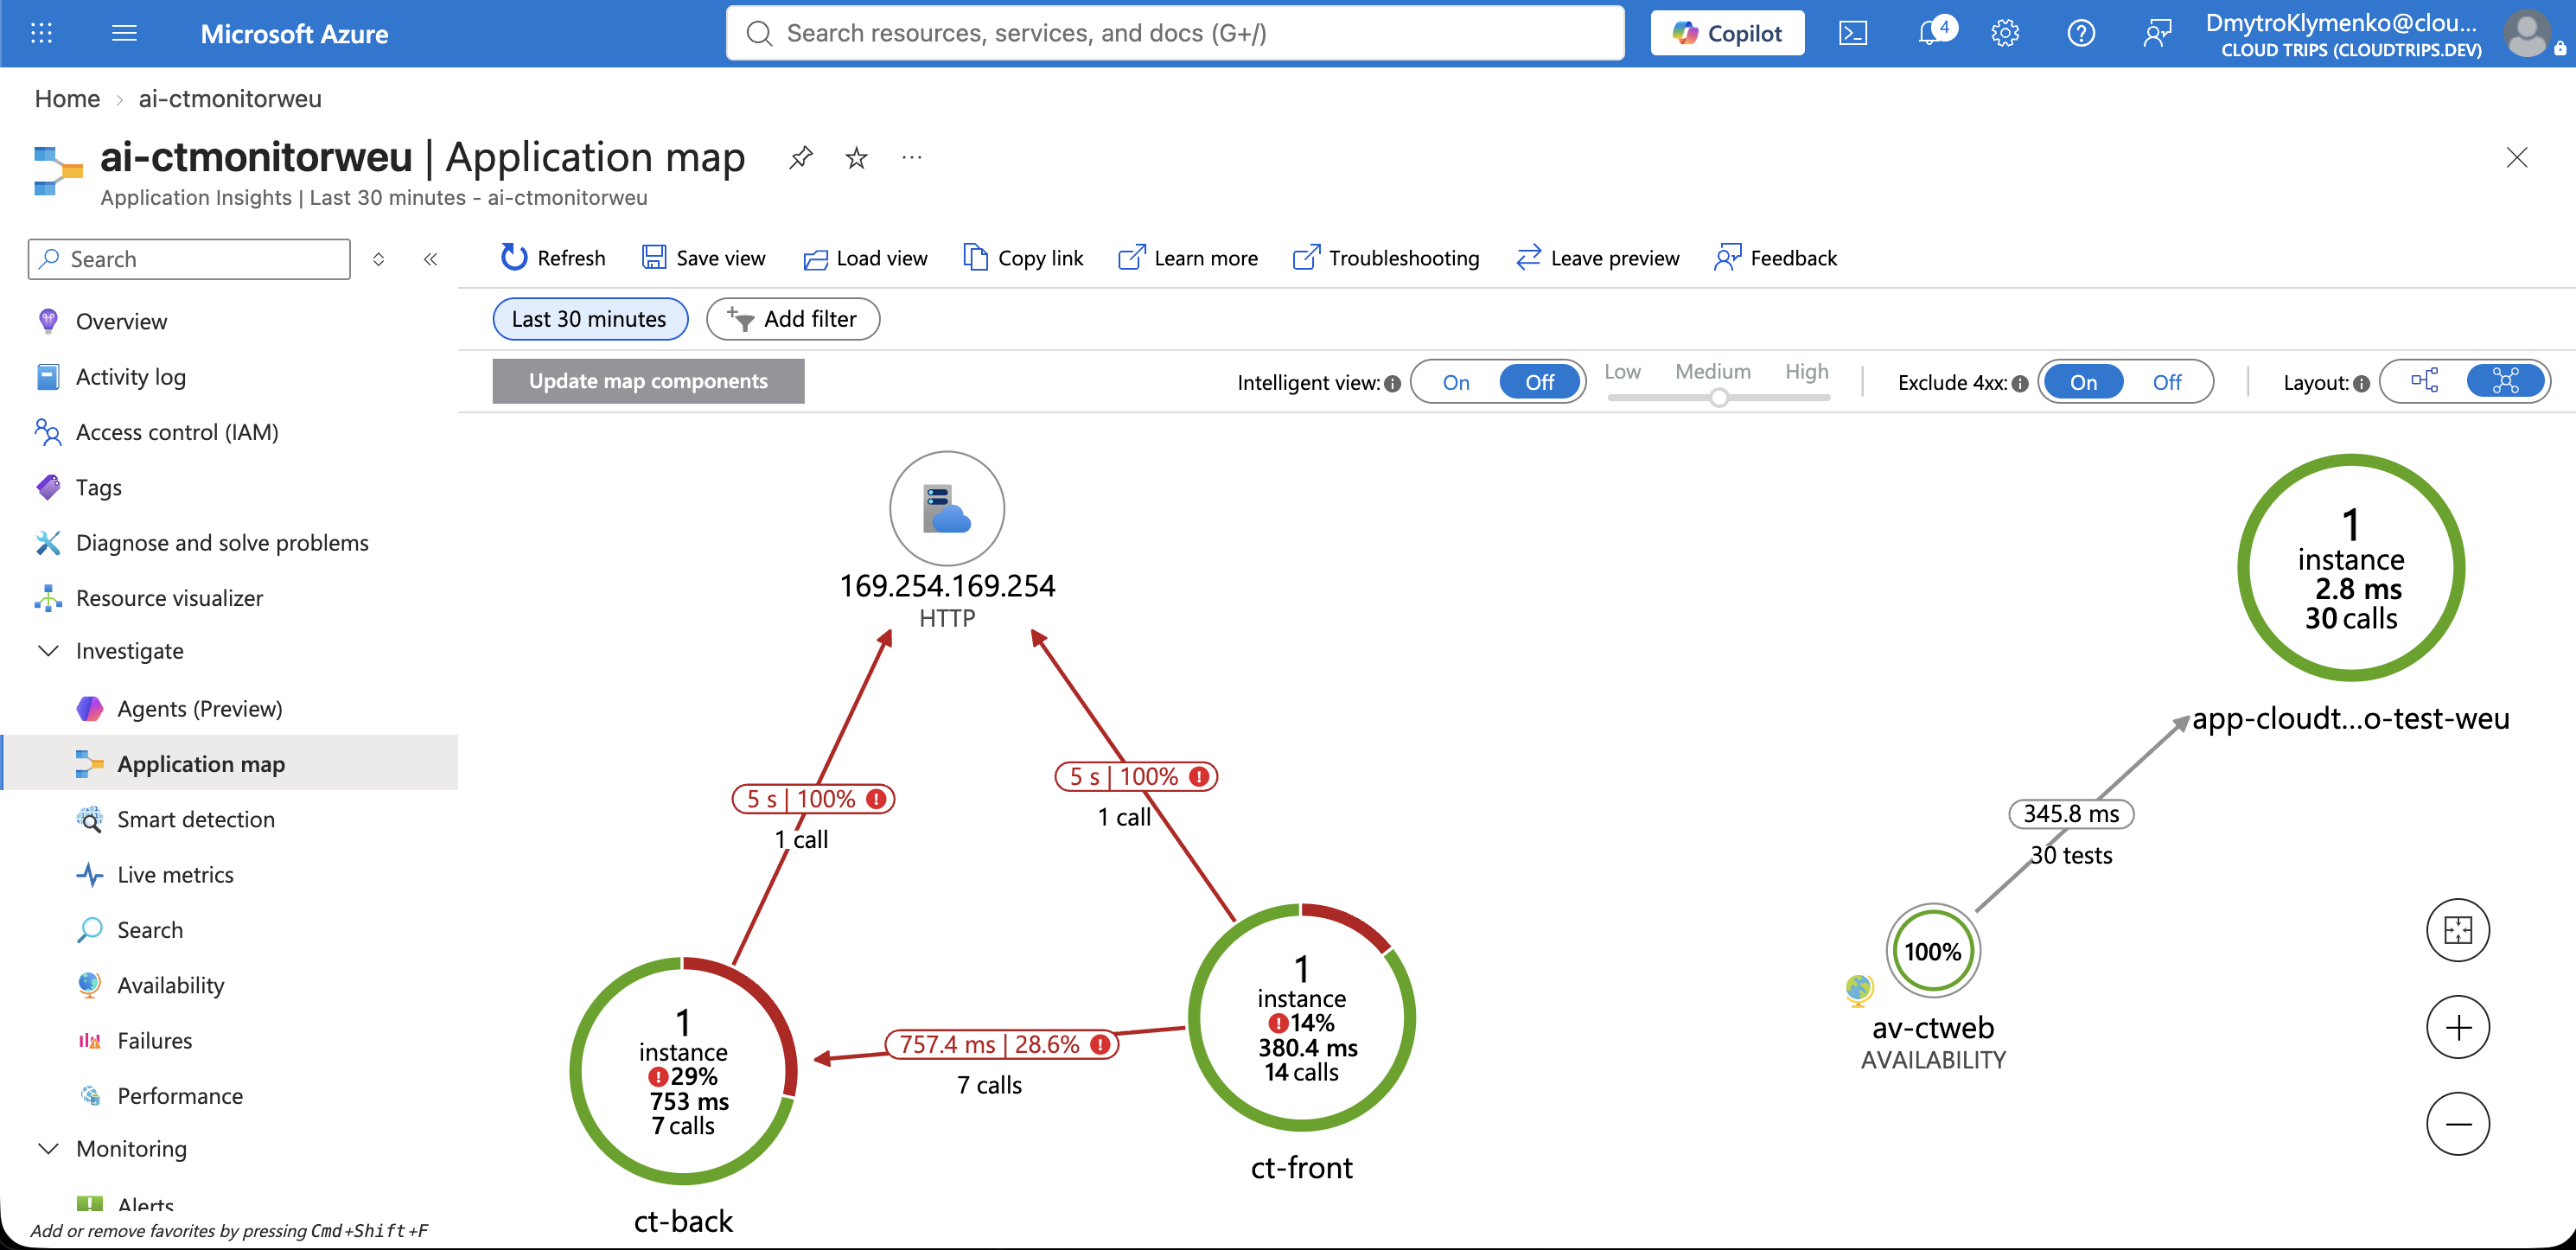
If telemetry is absent, check the connection string was set before npm start and that outgoing HTTPS is allowed. If you see only one role, confirm both processes started and that you visited /checkout. A new map can take longer to appear than its underlying request records.
Finish
Press Ctrl+C in the terminal to stop both services and flush telemetry. The example captures all traces at its small lab volume; a busy application needs a deliberate sampling and retention policy. Keep Application Insights only if you still need the recorded telemetry or other monitoring exercises.